

S&P 500, SPX Talking Points:
- Trade tensions remain a driver as stocks continue to show recovery from yesterday’s dip. But hope on that front combined with softer inflation provides catalyst for bulls as shown by today’s bounce above the 6k level.
- Next week’s FOMC rate decision is big: The Fed has refrained from sounding overly dovish so far this year, saying that uncertainty around tariffs produces reason for caution. But given the USD breakdown and SPX breakout this week, markets seem to be looking for the Fed to shift to a more dovish posture via their forecasts and projections.
- I look at the S&P 500 in the price action webinar and you’re welcome to join the next one. Click here to register.

It’s been a strong Q2 for equities and it definitely did not seem as though that would be the case in early-April trade. The tariff topic has been a big driver, but so too has FOMC policy and with the Fed refusing to talk up rate cuts even as economic data started to show weakness, the uncertainty of tariffs and possible repercussions were enough to drive an aggressive sell-off in equities to begin the quarter.
Since the second week of April, however, it’s been a far different story. And at this point, all that we’ve had was some softening on the tariff topic with the Fed still avoiding rate cut talk for fear of the inflationary impact of tariffs.
SPX is currently up just under 25% from those April lows and interestingly, that low was around the time that some noted pundits were warning of a ‘Black Monday’ type of event. The big question now is whether bulls can continue the push and for that, we’re likely looking to next Wednesday’s FOMC meeting, and specifically the projections that will be provided at that quarterly meeting, to see whether the Fed opens the door to dovish policy later in the year.
S&P 500 Weekly Price Chart
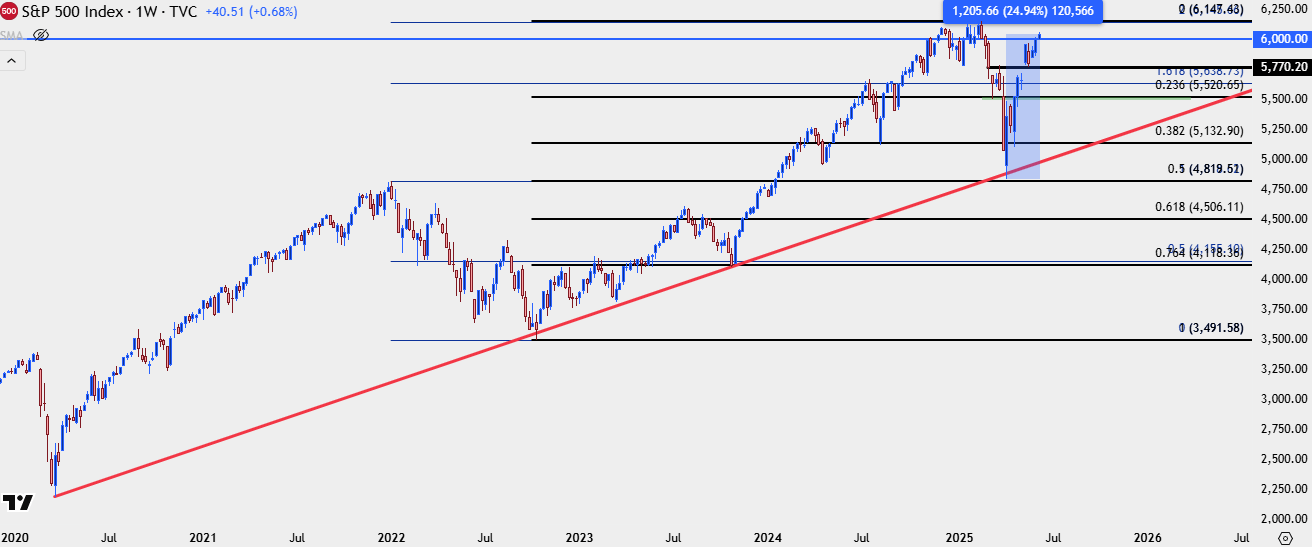 Chart prepared by James Stanley; data derived from Tradingview
SPX Daily
While the past two months have shown a strong one-sided bias, there has been pullback. When we were in April, there was a support test at a 38.2% Fibonacci retracement, and then at the end of the month another around the 23.6% retracement. In late-May we saw support at prior resistance of 5778 which led to another breakout, and just yesterday, we saw a pullback towards the 6k psychological level that has, so far, been defended, with bull pushing another bounce so far today.
S&P 500 Daily Chart
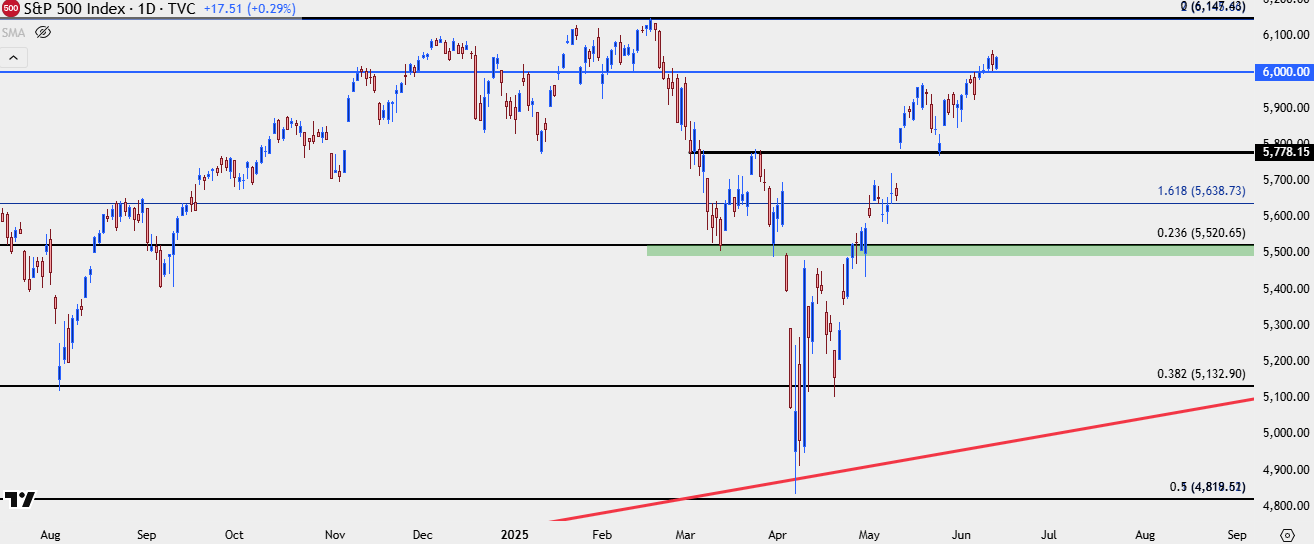 Chart prepared by James Stanley; data derived from Tradingview
SPX: Counter Scenarios
At this point with bullish momentum maintaining across most time frames, there is still scope for continuation. But with that said, if we consider the Fed’s stance so far this year and the fact that they haven’t yet seemed open to the idea of broadcasting cuts later in the year, we must at least entertain a counter scenario. But even that could have a bullish appeal…
The Fed hurriedly cut rates late last year and that’s when inflation began to push higher after bottoming in October at 2.4% for YoY headline CPI. In November, that pushed up to 2.6% and then 2.7% and then 2.9%. By the time we got to February headline inflation was already back to a 3-handle, and the question had to be asked whether the Fed cut too quickly and too aggressively.
At the same time, we had the playing out of the tariff scenario in the headlines and that’s what the Fed cited as an uncertainty around policy in the near-term. Since then, they haven’t seemed to fold much from that stance, even as we’ve seen CPI head lower with a 2.8% reading in March and a 2.4% reading in April; followed by 2.3% in May.
The expectation for this week is that trend of lower CPI would change, and it did, albeit by less than was expected. The expectation was for a 2.5% YoY headline CPI reading and it instead came in at 2.4%.
Judging by the reaction in the Dollar this news seems to place a more-dovish expectation around the FOMC for next week, and the same can be said for stocks, which pulled back towards 6k yesterday but have since clawed back today.
If the Fed refrains from sounding too dovish, and instead says it’s ‘meeting by meeting’ as they observe the data, fearful for the inflation impact of tariffs that remain in the headlines, there could be reason for bulls to take profits in equities and that could produce the counter scenario. At this point, there’s even a rising wedge formation that could support that thesis.
The big question then is whether a sell-off would have a larger impact on a trend reversal or whether it would be another simple pullback. And given the reaction since Trump’s softening on tariffs in April, I’m leaning towards the latter camp.
For deeper support, I have a swing-high turned swing-low around 5940, followed by a large zone of unfilled gap running from 5802 up to 5854. If sellers can evoke a closed daily candle through the 5778 level, that’s when I’ll begin to entertain bigger picture reversal scenarios in SPX.
SPX Four-Hour Price Chart
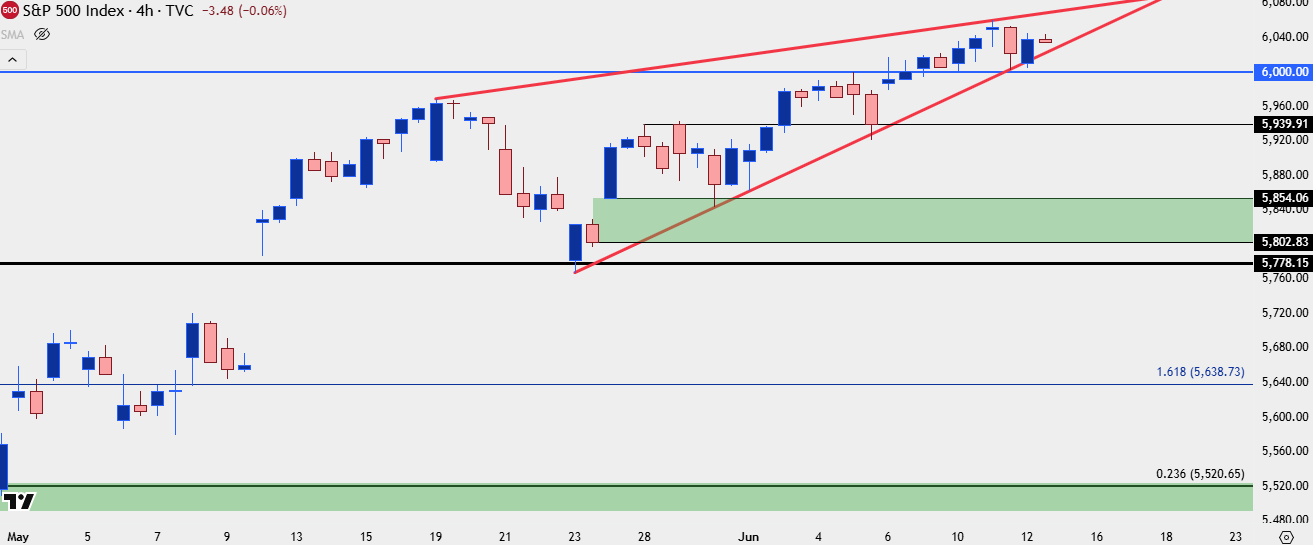 Chart prepared by James Stanley; data derived from Tradingview
--- written by James Stanley, Senior Strategist
Latest market news
September 18, 2025 02:48 PM
June 23, 2025 01:22 PM
June 23, 2025 10:39 AM
June 20, 2025 05:23 PM
June 20, 2025 04:46 PM
June 20, 2025 03:35 PM

June 19, 2025 11:09 PM

June 18, 2025 09:32 PM
June 17, 2025 10:59 PM
June 16, 2025 10:27 PM