
S&P 500 Talking Points:
- Stocks jumped yesterday with S&P 500 futures gained an even 10% and Nasdaq 100 futures more than 12%.
- The driver behind the move was an announcement from President Trump that tariff implementation would be delayed by 90 days for every country other than China, were tariffs would actually increase to 125%.
- A rally such as we saw yesterday is unusual, but perhaps the bigger question is whether sellers use the move to set up bearish continuation strategies and the answer to that will show in the coming days.

Yesterday was one of the largest gains in the stock market – ever. S&P 500 futures gained an even 10% and perhaps even more noticeably sentiment seemed to shift from the gloom and doom that we saw earlier in the week to the fear of missing out driving bullish momentum.
If we parse through the drivers, there are still risks to be seen, namely in the fact that Treasury yields remain high and the concept of driving yields down by using tariff risk in order to re-finance a trove of maturing long-term debt later in the year seems to be a less viable option. As of this writing, 10-year yields sit above 4.2%, and they were around the 4% marker just after last week’s tariff announcement.
It was that move in yields that begs the question as to whether that was behind yesterday’s shift – or if that was the plan all along. U.S. Treasury Secretary Scott Bessent alluded to the latter as he said that Trump had informed him on Sunday that the plan was to isolate China; and that would mesh with President Trump’s approach from his first term in office when he had a hardened focus on trade with China.
But there does still remain risk of recession even if banks have downgraded that risk a bit. Goldman Sachs is a good example, as yesterday saw the bank share that their base case was for a recession in the U.S. later in the year on the back of tariff risk. But after the tariff delay, they revised that forecast, saying that there was only a 45% risk of recession given the change. This sounds like a bank hedging their bets but the reality is we’re still looking at slowdown in the U.S. economy from many data points, and the Fed is perhaps even more cautious of cutting rates because of the opaque risk around what tariffs might bring. As we heard from Powell last Friday, the Fed continues to expect inflationary impact from tariffs, which brings a bit more of a question mark around rate cut expectations for later in the year. And perhaps more notably, the ‘Fed put’ that markets have become accustomed to in the post-GFC backdrop is still noticeably missing as the head of the U.S. Central Bank didn’t seem to alarmed in his speech last Friday even with equities hurdling lower.
But – and this is a big ‘but,’ – we have seen softening from the executive branch and that does produce an item of change. When Powell gave that speech last Friday both Trump and the Fed appeared to be in a spot where they weren’t too bothered by equity losses, and that’s perhaps what really dominated the market’s behavior.
I have two main questions at this point and I think we’ll get some clues to answer each in the next few days; but the main question is whether investors use this bounce to sell equities, thereby continuing bearish trends that started in February. For the S&P 500, I’m continuing to track the gap from last week’s initial tariff announcement as a line-in-the-sand.
The second and perhaps more important question – is whether the sell-off that we’ve seen in bonds attracts capital from stocks as its become clear that the Treasury wants to see lower rates in order to re-finance bonds later in the year. That can be a tough gambit, as we know that the Treasury wants to add significant supply of longer-term bonds this year; and that’s not exactly a compelling argument to produce demand. But -locking up a 4.5% or even a 4.2% yield over the next 10 years might not be a negative prospect, especially if we’re seeing inflation numbers continue to soften as we did again this morning.
I think ideally, especially if we are seeing some capital drive from equities into bonds, the shift will be slow-moving; and theoretically this could allow for a more subtle shift without equities absolutely getting pummeled.
In the S&P 500, there’s higher-low support potential given yesterday’s breakout and at this point, stocks are testing the gap from last Fridays open. If we do see bulls push, there’s a line in the sand at 5,500, and this can be extended all the way up to the unfilled gap (in purple below) from last Thursdays open.
Above that, we have the 200-day moving average and those levels present an attractive area for sellers to take a shot. If they don’t, however, and if buyers are able to push through, broader topside trends will take over.
S&P 500 Two-Hour Price Chart
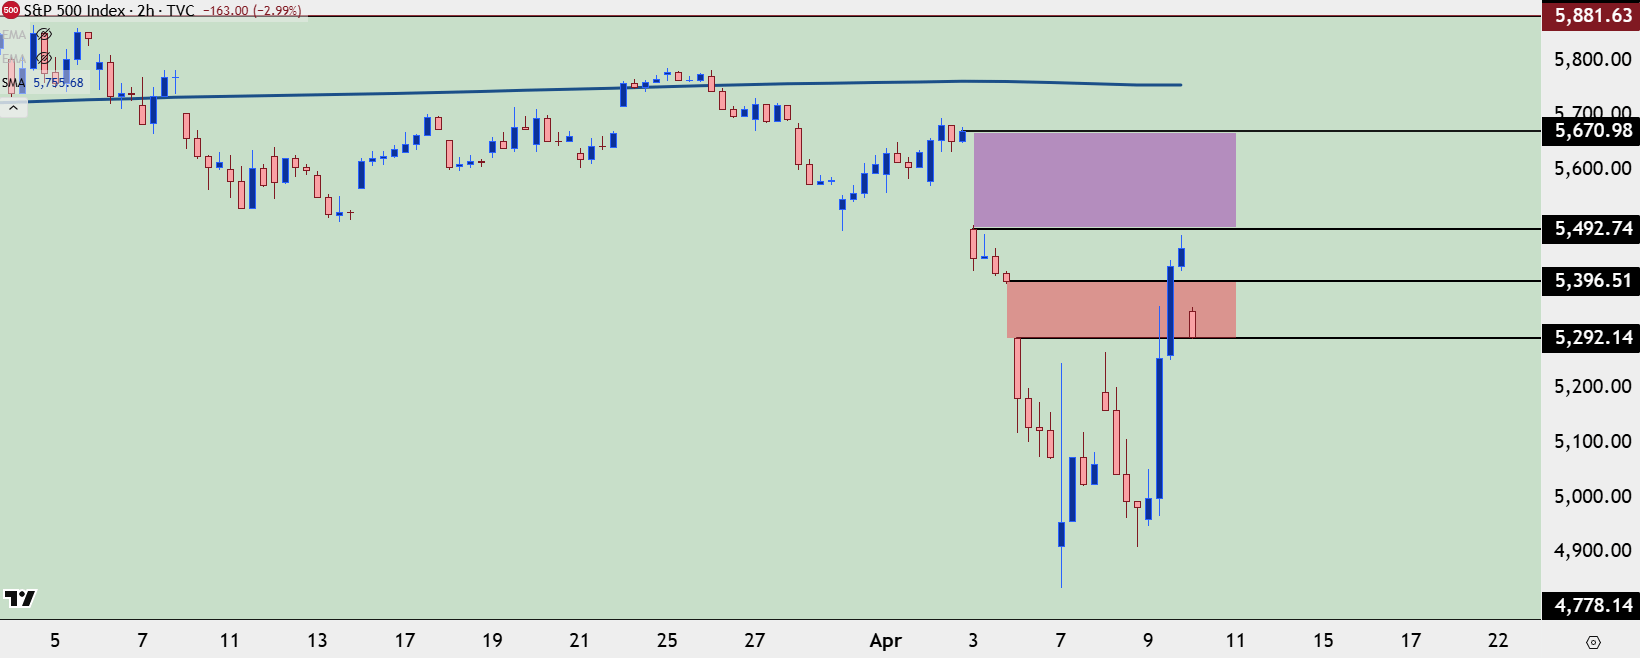 Chart prepared by James Stanley; data derived from Tradingview
S&P 500 Bigger Picture
Futures and cash markets can differ slightly but the round-the-clock nature of futures can offer some additional detail for price action. And given the bigger picture backdrop which I spoke about on Monday, a long-term Fibonacci level had come into play shortly after the Sunday open and, so far, has set the lows around 4834.
I also looked at equities in this weekend’s forecast, and keep in mind, this was over a weekend where many were calling for a ‘Black Monday’ at the open. But, as I had highlighted there, stocks were showing a very oversold backdrop and those can be difficult to push for bearish continuation, which helped the support referenced above to hold the lows and lead to a bounce on Monday.
Well, given the additional reference of a recent sell-off to work with, we can add another Fibonacci retracement to the downside move to provide some more context, and the 5148 level becomes even more important as that is both the 38.2% retracement of the long-term move, and near the 23.6% retracement of the recent sell-off. That becomes a big spot that bulls would want to defend to retain topside momentum, and the 5k level is the next spot of major support below that.
S&P 500 Weekly Chart
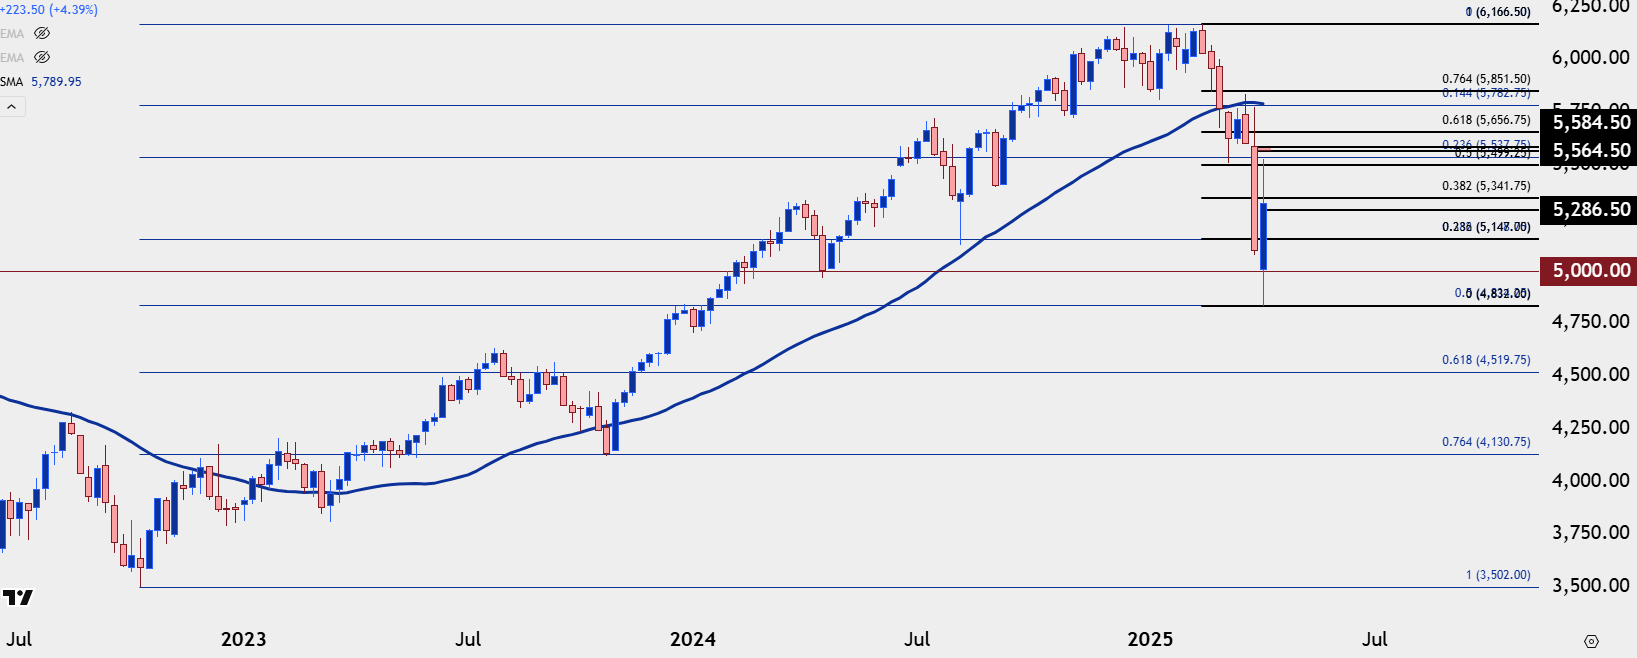 Chart prepared by James Stanley; data derived from Tradingview
From the shorter-term four-hour chart, the importance of 5500 becomes clear and above that, there’s the gap from last week’s tariff announcement running over a 20-handle space from 5564.50 up to 5584.50. That becomes the next major obstacle for bulls if they are to continue the trend.
The 5431 level is currently being tested and that also remains a point of near-term support potential, as that’s the 38.2% Fibonacci retracement of the sell-off.
S&P 500 Four-Hour Price Chart
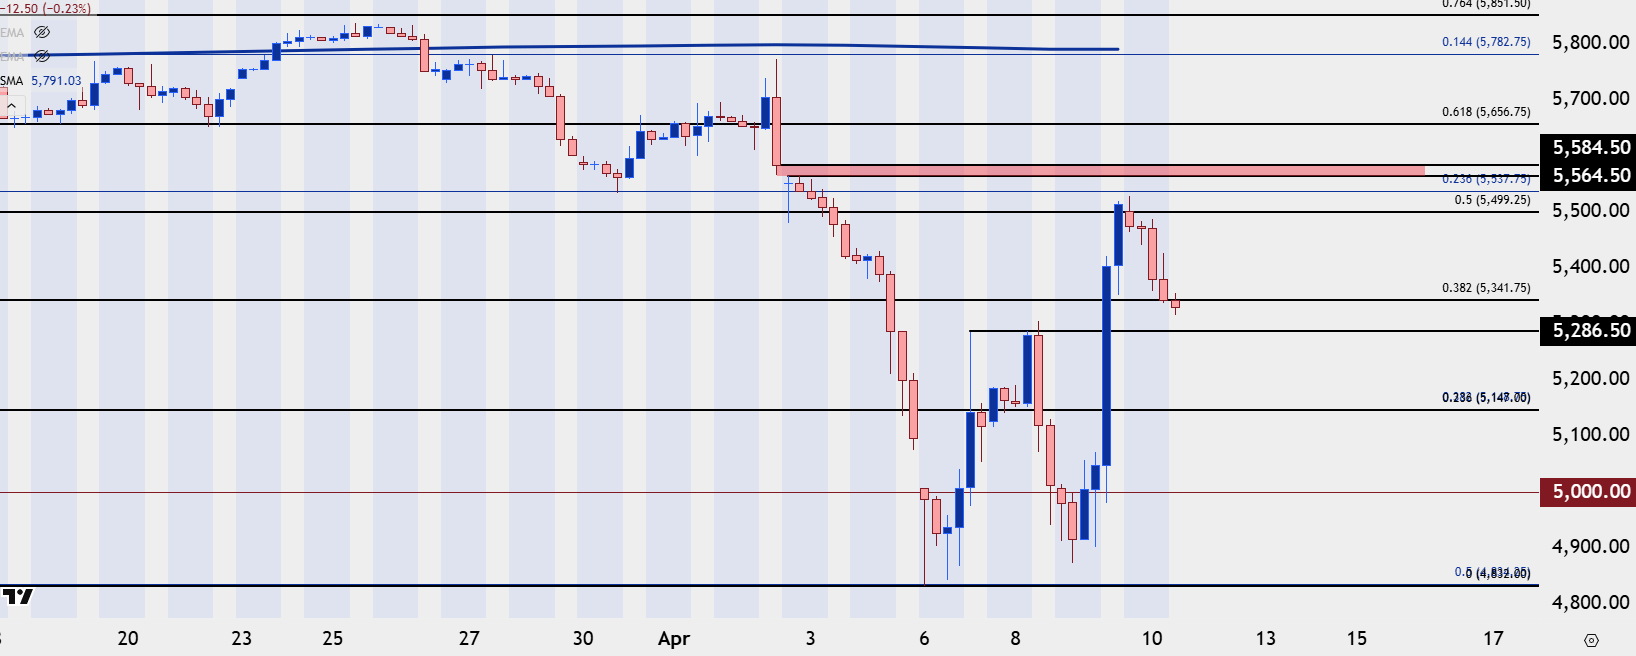 Chart prepared by James Stanley; data derived from Tradingview
--- written by James Stanley, Senior Strategist
Latest market news
September 18, 2025 02:48 PM
June 23, 2025 01:22 PM
June 23, 2025 10:39 AM
June 20, 2025 05:23 PM
June 20, 2025 04:46 PM
June 20, 2025 03:35 PM

June 9, 2025 09:32 AM

May 12, 2025 06:44 AM
April 27, 2025 02:00 PM