

US Dollar Index Technical Outlook: USD Short-term Trade Levels
- US Dollar rebounds off support at multi-year lows- attempting second weekly rally
- USD now testing resistance, risk for price inflection- NFPs on tap tomorrow, Fed next week
- Resistance 99.96-100.42, 101.77/92 (key), 102.95/99 - Support 97.71-98.39 (key), 95.17, 94.65
The US Dollar Index marked a fourth monthly decline in April with DXY plunging more than 11.1% off the yearly high. A rebound off support last week has extended more than 2.2% off the yearly low with DXY now poised to mark a second consecutive weekly advance ahead of tomorrow’s highly anticipated Non-Farm Payroll report. Battles lines drawn on the DXY short-term technical charts.
Review my latest Weekly Strategy Webinar for an in-depth breakdown of this US Dollar technical setup and more. Join live on Monday’s at 8:30am EST.US Dollar Index Price Chart – USD Daily
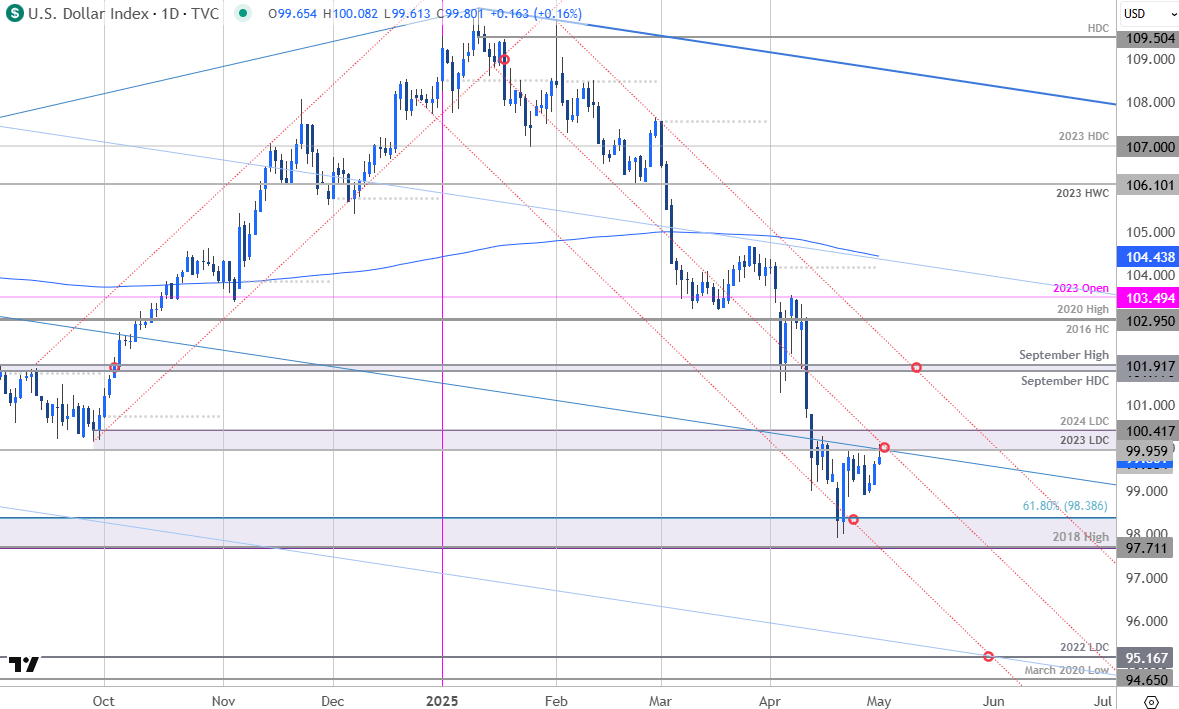
Chart Prepared by Michael Boutros, Sr. Technical Strategist; DXY on TradingView
Technical Outlook: The US Dollar is testing resistance today at the 2023 / 2024 low day closes (LDC) at 99.95-100.42- looking for possible infection off this mark in the days ahead.
US Dollar Index Price Chart – USD 240min
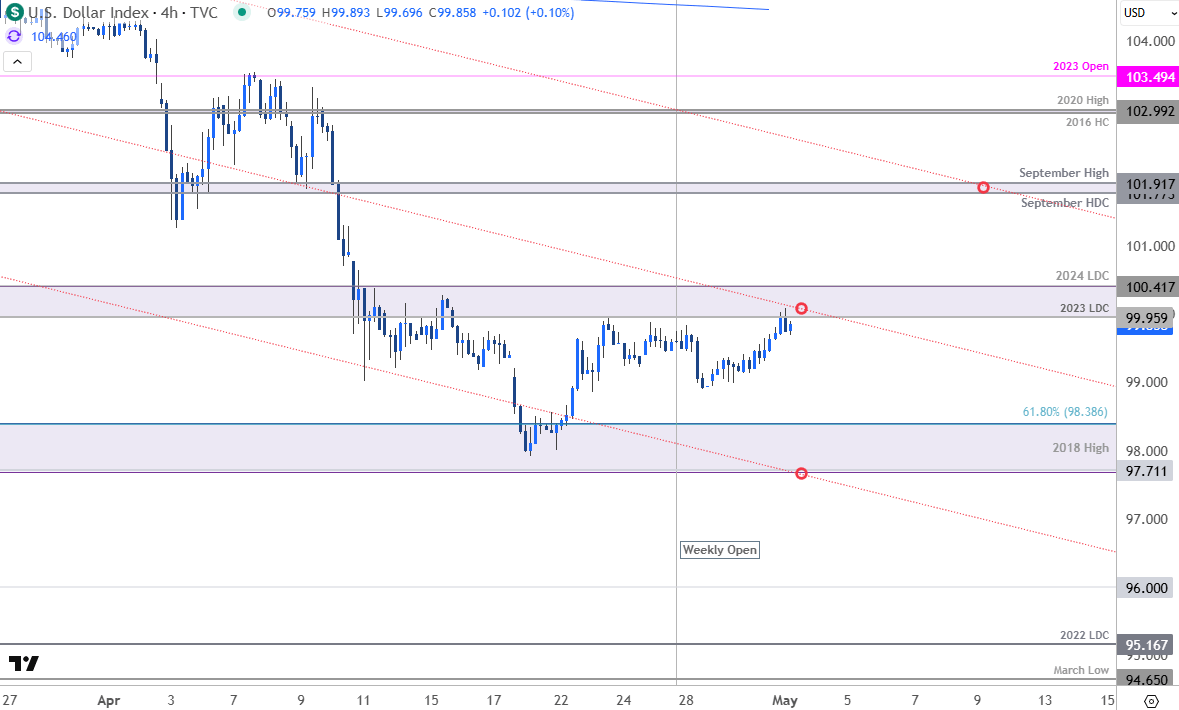
Chart Prepared by Michael Boutros, Sr. Technical Strategist; DXY on TradingView
Notes: A closer look at USD price action shows the index trading into the resistance at the median-line in early U.S. trade. A topside breach above this threshold is needed to validate a breakout of the weekly opening-range with subsequent resistance see at the September high-day close (HDC) / September high at 101.77/92. Note that channel resistance converges on this threshold over the next few weeks and a breach / close above this slope would be needed to suggest a more significant low was registered last week / a larger reversal is underway. Subsequent resistance eyed at the 2016 high-close / 2020 high at 102.95/99 and the 2023 yearly open at 103.49.
Key support remains unchanged at the 2018 swing high / 61.8% retracement of the 2018 advance at 97.71-98.39- a close below this threshold would threaten another bout of accelerated USD losses with subsequent support seen at the 96-handle, the 2022 LDC at 95.17 and the March 2020 low at 94.65.

Bottom line: A rebound off key support takes the U.S. Dollar into initial resistance with major event risk on tap tomorrow. From a trading standpoint, losses should be limited to this week’s low IF price is heading higher on this stretch with a breach above 100.42 needed to fuel the next leg of the recovery.
Keep in mind we have U.S. Non-Farm Payrolls on tap tomorrow with the FOMC interest rate decision slated for next week. Stay nimble into the releases and watch the weekly closes here for guidance. Review my latest US Dollar Weekly Forecast for a closer look at the longer-term DXY technical trade levels.
Key US Economic Data Releases
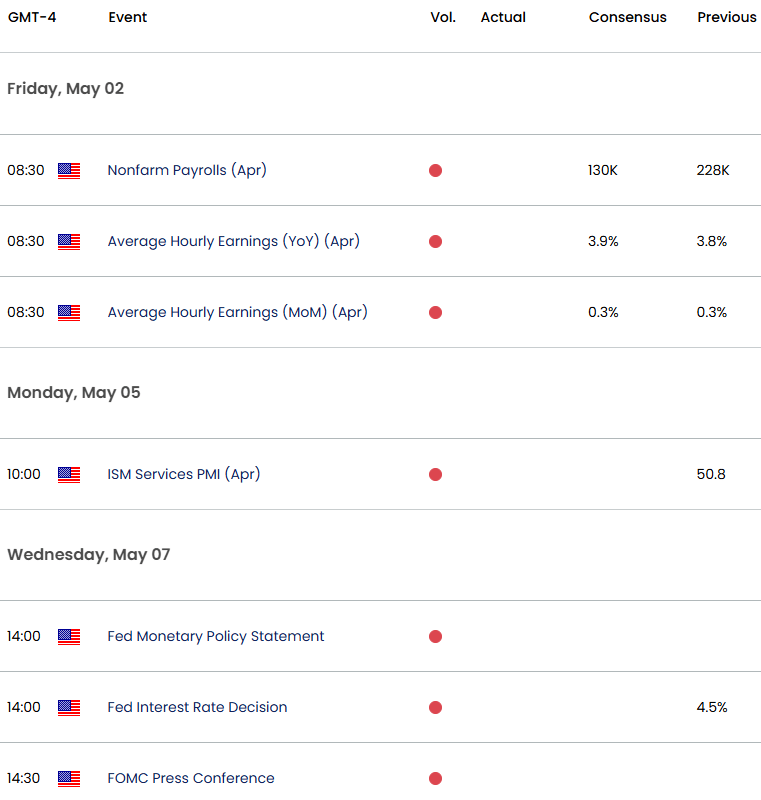
Economic Calendar - latest economic developments and upcoming event risk.
Active Short-term Technical Charts
- Euro Short-term Outlook: EUR/USD Breakout Looms, NFP on Tap
- Japanese Yen Short-term Outlook: USD/JPY Coils Ahead of BoJ, NFP
- British Pound Short-term Outlook: GBP/USD Bulls Eye 2024 High
- Australian Dollar Short-term Outlook: AUD/USD Halted at Resistance
- Canadian Dollar Short-term Outlook: USD/CAD Breakout Imminent
Written by Michael Boutros, Sr Technical Strategist with FOREX.com
Follow Michael on X @MBForex
Latest market news
September 18, 2025 02:48 PM
June 23, 2025 01:22 PM
June 23, 2025 10:39 AM
June 20, 2025 05:23 PM
June 20, 2025 04:46 PM
June 20, 2025 03:35 PM

May 28, 2025 03:30 PM

May 16, 2025 08:50 AM

April 17, 2025 11:48 AM

March 27, 2025 04:35 PM