

US indices may still be grinding higher, but it’s clear they’re making hard work of it. Despite positive headlines from US–China trade talks, Wall Street appears less enthused. Markets seem to be suffering from trade war fatigue, with volatility receding and once-reliable themes like the TACO trade (Tech, AI, Chips, Oil) beginning to stall. While the broader trend remains up, the slow, choppy nature of the rally suggests bulls should tread carefully at these elevated levels.
View related analysis:
- Nasdaq 100 Leads Wall Street Higher on Consumer Sentiment Rebound
- ASX 200, Hang Seng, Nikkei 225 Futures: Bull Rallies Face Resistance
- US Dollar Outlook: Don’t Write Off the USD Just Yet
- Gold Outlook: Seasonal Weakness and Fading Momentum Hint at June Pullback
Wall Street Futures Technical Analysis: S&P 500, Nasdaq 100, Dow Jones
All three major Wall Street futures — the S&P 500, Nasdaq 100, and Dow Jones — are showing signs of exhaustion. Rising wedge formations and fading momentum near key resistance levels suggest a potential reversal. With bullish catalysts like the US–China trade deal already priced in, the inability to push significantly higher may leave these indices vulnerable to a pullback.
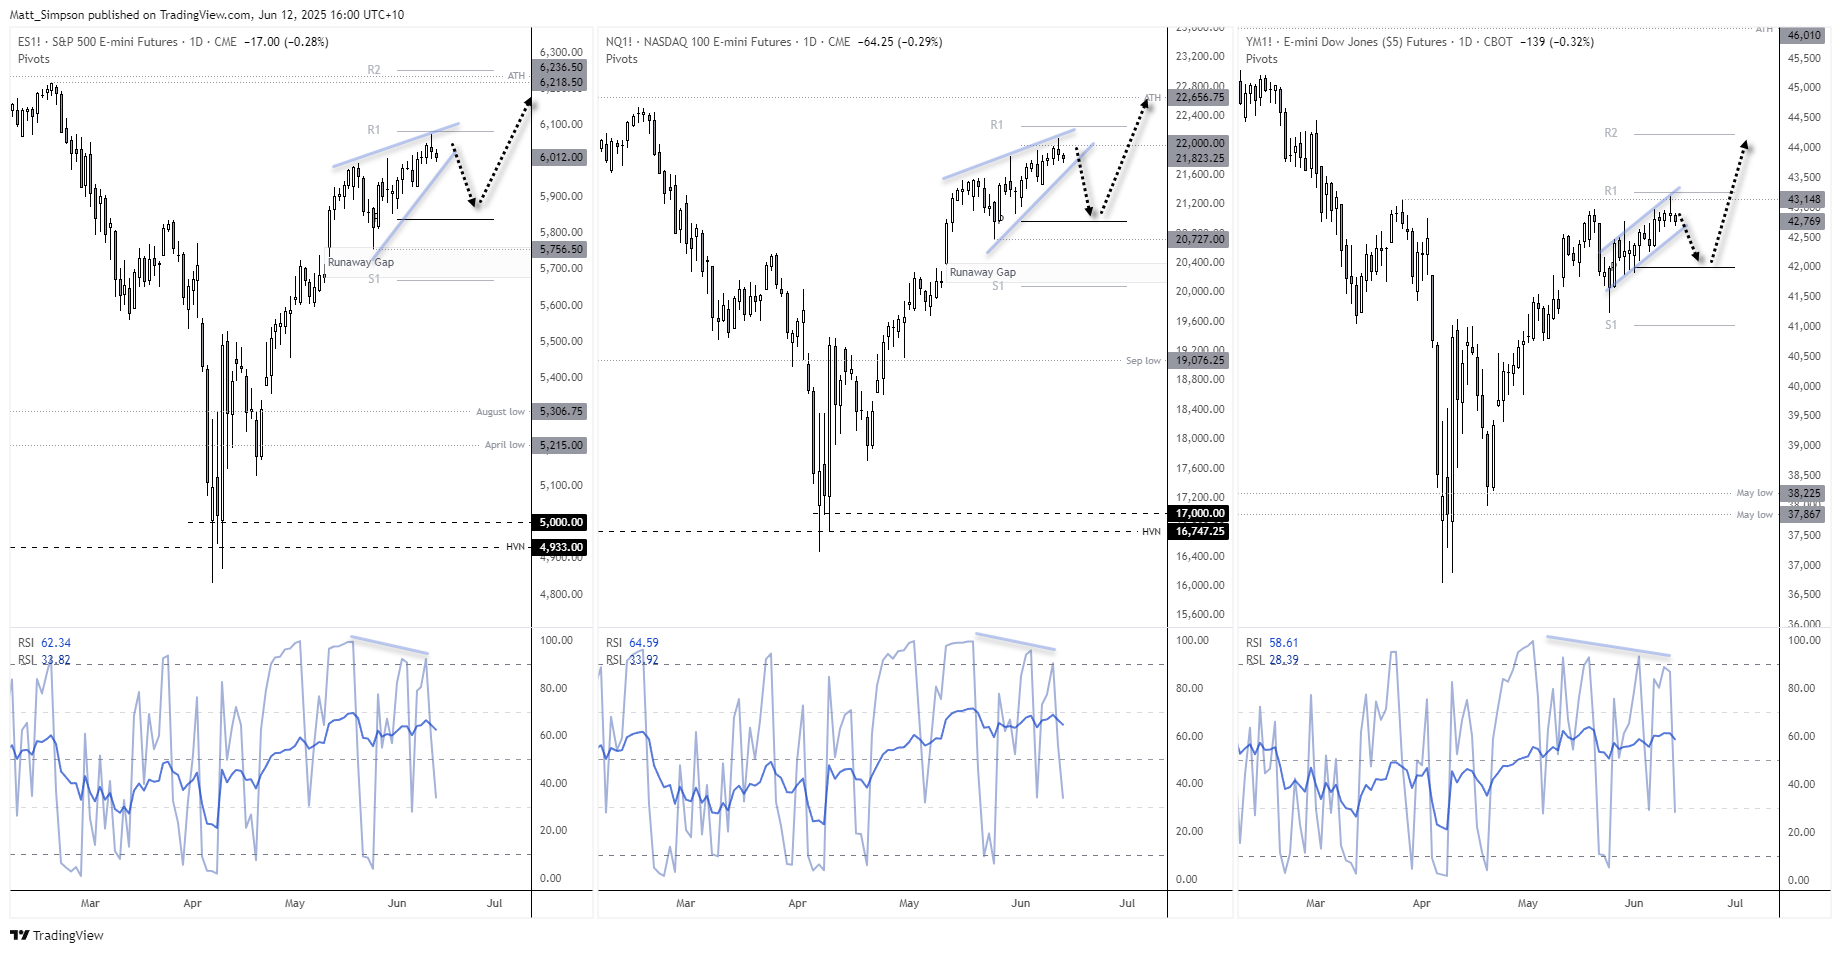
S&P 500 Futures (ES) Technical Analysis
The S&P 500 futures market entered a technical bull market on Tuesday with its 20% rally from the daily-close low on April to Tuesday’s close. I have noted over the years such achievements are quite often followed by a reversal, as if traders are waiting to book profits on the ‘bull market’ headlines. It comes as no major surprise to see Wednesday was a small shooting star candle.
Furthermore, a rising wedge is forming on the daily charts with a bearish divergence on the RSI (14) and RSI (2) in the overbought zone. The rally has also paused just beneath the monthly pivot point (6083.25)
The rising wedge projects a target near its base at 5765.5, which is near the supposed ‘runaway gap’. If prices get that far we can safely say it was never a runaway gap after all – as they remain in the centre of very strong trends.

Nasdaq 100 Futures (NQ) Technical Analysis
The tech-heavy Nasdaq 100 has led Wall Street’s recovery, surging 34.3% from the April low to this week’s high. However, bearish reversal signals are emerging. A rising wedge pattern — often a precursor to a pullback — is forming alongside bearish divergences on key momentum indicators.
Unlike the S&P 500, Nasdaq 100 futures have yet to reach the monthly R1 pivot, leaving potential room to stretch higher. Still, if the wedge breaks lower, a downside target near 20,727 comes into focus. Traders should also watch the 21,000 region, where the monthly pivot point at 20,970 could act as interim support.
Dow Jones Futures (YM) Technical Analysis
While Dow Jones futures lack the rising wedge formations seen on the S&P 500 and Nasdaq 100, they may still present the most compelling bearish setup if market sentiment turns. The Dow’s 17.7% rally from the April low is the weakest of the three major Wall Street indices, and prices have stalled just below the March 7 high. A bearish pin bar has formed at this resistance zone, which coincides with the monthly R1 pivot.
Bearish divergences on the daily RSI (14) and RSI (2) add technical weight to the downside case, and a break below support could invalidate a minor bullish channel on the daily chart — potentially exposing the Dow Jones to a deeper correction.
-- Written by Matt Simpson
Follow Matt on Twitter @cLeverEdge
Latest market news
September 18, 2025 02:48 PM
June 23, 2025 01:22 PM
June 23, 2025 10:39 AM
June 20, 2025 05:23 PM
June 20, 2025 04:46 PM
June 20, 2025 03:35 PM

May 28, 2025 03:30 PM

May 16, 2025 08:50 AM

April 17, 2025 11:48 AM

March 27, 2025 04:35 PM