

U.S. Dollar, USD Talking Points:
- The U.S. Dollar has shown initial signs of recovery after a strong sell-off spanned from March through early-April. While stocks were initially selling off alongside DXY, equities pivoted when Trump delayed tariffs on everyone but China yet the USD remained near support at multi-year lows.
- The Fed has so far refrained from talking up rate cuts for fear of inflationary pressure from tariffs. Next week is the next big item in that story with the Wednesday FOMC rate decision.
- Below I look at the USD from four different perspectives and I’ll provide an updated look in the Tuesday webinar. Click here for registration information.
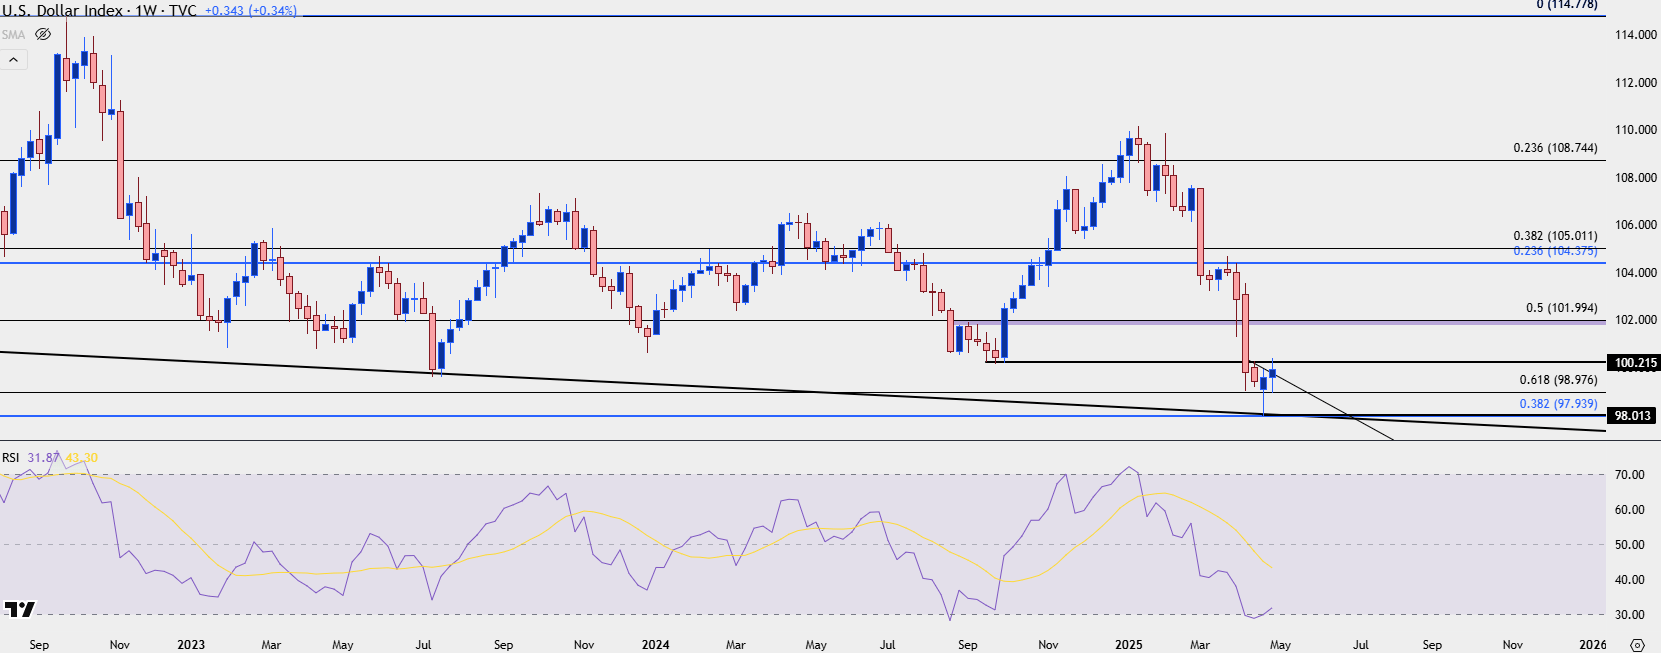
It was a big week for the USD from both a fundamental and a technical perspective. From the tech side of the matter, DXY had just finished its first green week in more than a month after running into a massive spot of confluent support. This happened alongside a rather rare occurrence of an oversold RSI reading on the weekly chart. And from the fundamental side of the equation, there was both inflation and employment data on the calendar with the Wednesday PCE report and the Friday NFP release.
Those factors helped the USD to continue a bounce, all the way until the initial resistance I was tracking in last Tuesday’s webinar came in to hold the highs at 100.22. That has, so far, led to pullback on Friday which is leaving a doji on the weekly chart following last week’s bounce.
U.S. Dollar Weekly Price Chart
USD Bigger Picture
Taking a quick step back for some context, it’s the monthly chart that remains of interest given that response to support a couple weeks ago. That support comes from two different items, with a trendline projection and a 38.2% Fibonacci retracement at 97.94. A second Fibonacci retracement taken from the 2021-2022 move has so far helped to set a higher-low at 98.98, but given the response to that area after a break down to multi-year lows, the month of May brings pullback potential for the Dollar; and that could, possibly, turn into something more. But it will probably need some help from the FOMC to drive a larger bullish move.
U.S. Dollar Monthly Price Chart
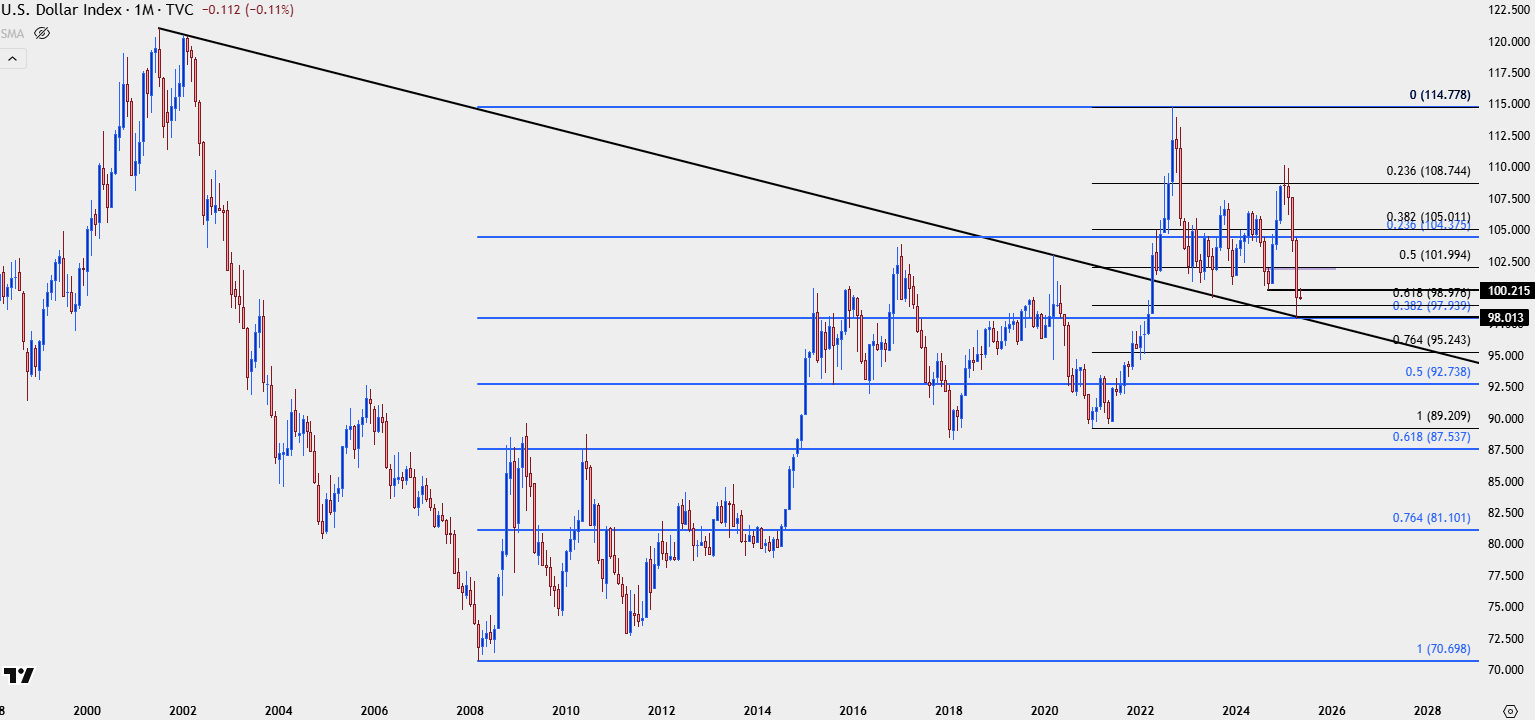 Chart prepared by James Stanley; data derived from Tradingview
Can the USD Turn the Corner?
This was the central theme when looking at USD pullback or reversal scenarios over the past week. While the USD was oversold on the weekly and while there was a massive support level in-play, the fact of the matter is that turns can take time, especially given how aggressively bears have hit DXY over the past few months.
As a case in point, USD came into 2025 with a full head of steam, but January was a doji and February started to show symptoms of a turn. But it was March and early-April when sellers were really able to run and take over near-term price action.
And as I shared in videos over the past couple weeks, if we look at prior oversold RSI reading on the weekly DXY chart, those, too, took time to lead in to turns. The prior example in Q3 of last year saw sellers push for another five weeks after the oversold reading. Eventually, bulls took over and drove a massive bullish reversal but timing the move was a challenge as there was more than a month of gyration before buyers could actually take control.
And in the example before that, all the way back in 2017 and 2018, there were two oversold RSI readings on the weekly. The first led to a pullback but sellers were still hungry for more, so they jumped on that and continued the move down to fresh lower-lows. But the second RSI oversold reading was divergent, and bulls took over in a big way and to date, that low has not yet been taken out.
So there remains initial criteria for a turn in the USD but it’s still too early to say that buyers are going to be able to take control to drive this minor pullback into a full-on reversal. But FOMC next week and perhaps more importantly, the price action around it, can help to paint that picture with a bit more clarity.
From the daily chart below, we can see that 100.22 level holding the highs at this point. But there’s also the inverse head and shoulders pattern that gave way from the four-hour chart earlier in the week and that highlights continued bullish potential, given that we’ve now had a successive higher-high and a higher-low. This would also put emphasis on the 98.98 level as a key spot of support for early next week, ahead of the FOMC meeting.
U.S. Dollar Four-Hour Price Chart
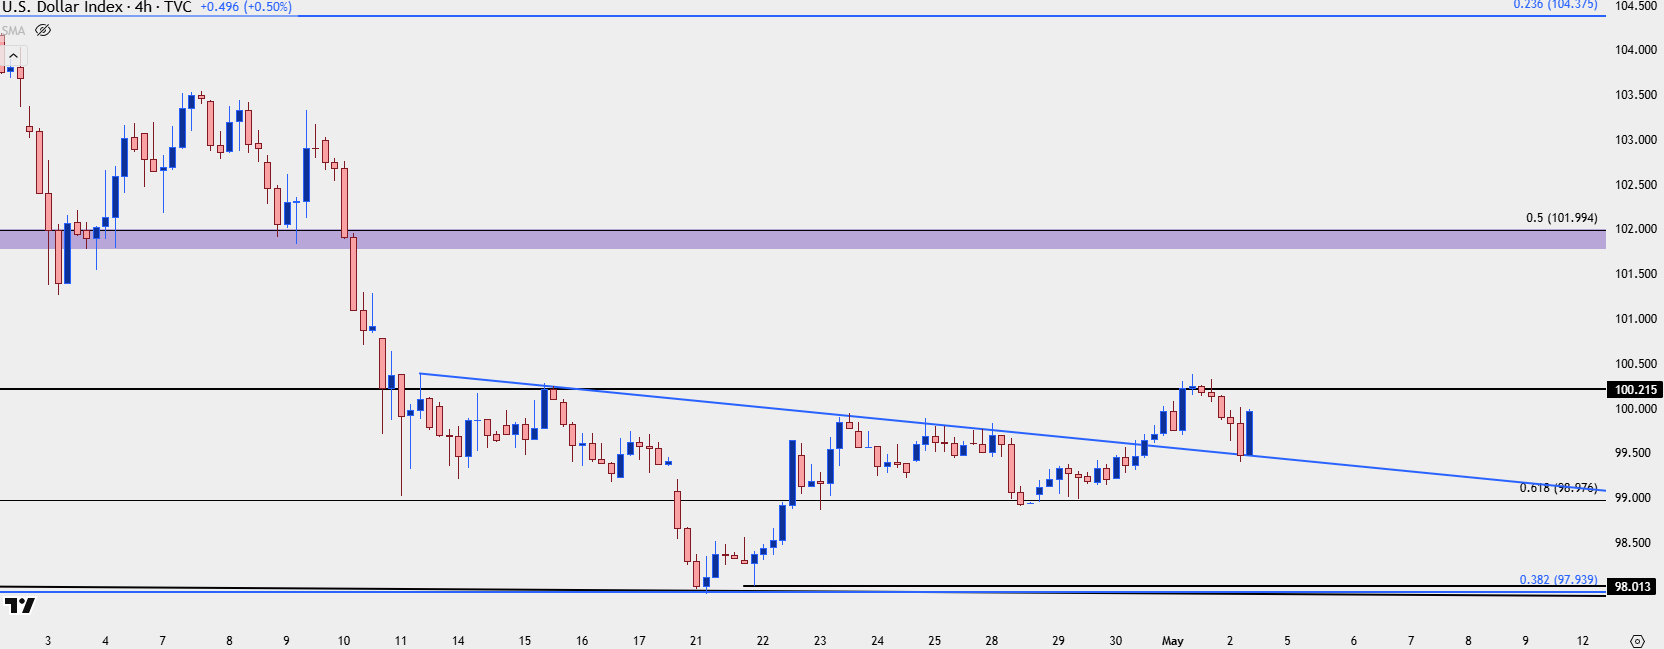 Chart prepared by James Stanley; data derived from Tradingview
USD/CAD
Given the recent bounce in the USD, even with it being a somewhat mild move, the fact that USD/CAD continues to sit near support after a newly-established low highlights the fact that the pair could remain attractive for USD-weakness scenarios.
I’ve been focusing on the longer-term range in the pair for months at this point and the April break below 1.4000 keeps that mean reversion scenario front-and-center. The challenge at this point is that there hasn’t been much for pullbacks and when the pair has tried to pull back, sellers have stood at the ready to swat the offer back down.
There’s breakdown potential in USD/CAD, but if we do get a larger USD pullback then there’s also a couple spots of resistance to look to for lower-highs, as I had highlighted in the Tuesday webinar.
USD/CAD Daily Price Chart
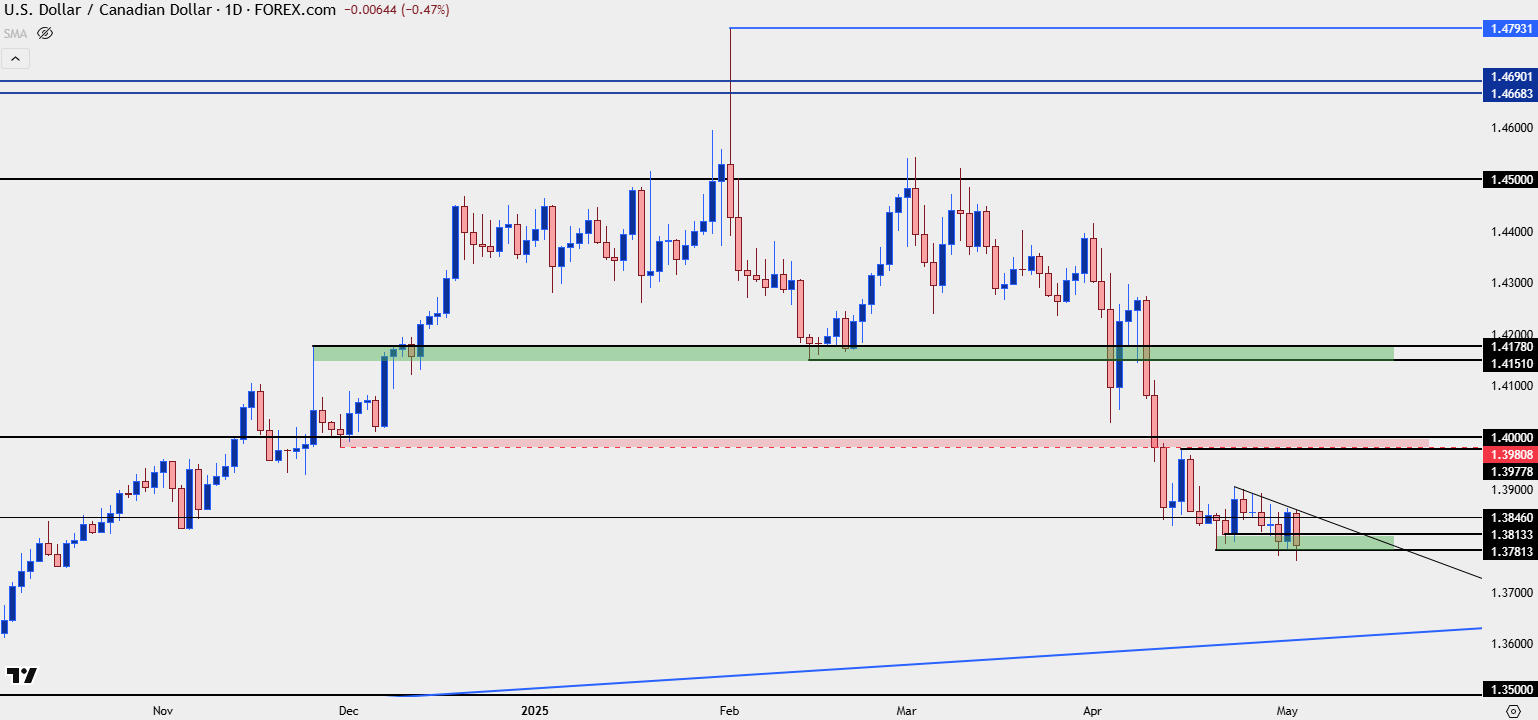 Chart prepared by James Stanley; data derived from Tradingview
EUR/USD
Given the 57.6% weighting of the Euro in the DXY quote, it makes sense to investigate bearish potential there if we’re looking for a bullish run in the Dollar. In some cases, the two markets are displaying mirror image-like qualities, although that can diverge as there’s another 42.4% of DXY that is not explained by the Euro.
The inverse head and shoulders in DXY shows a head and shoulders pattern in EUR/USD below. As I said earlier in the week, given how strong bulls pushed the move, we can’t quite consider this bearish until some key supports start to get takenout.
That hasn’t really happened yet, as the 1.1275 level that held the lows in mid-April came back to hold the lows again into Friday; but that does set the stage for a possible lower-high that could lead into a larger pullback scenario. For next support, the 1.1200 handle looms large as this was the 2024 high in the pair that held on several attempts.

EUR/USD Four-Hour Chart
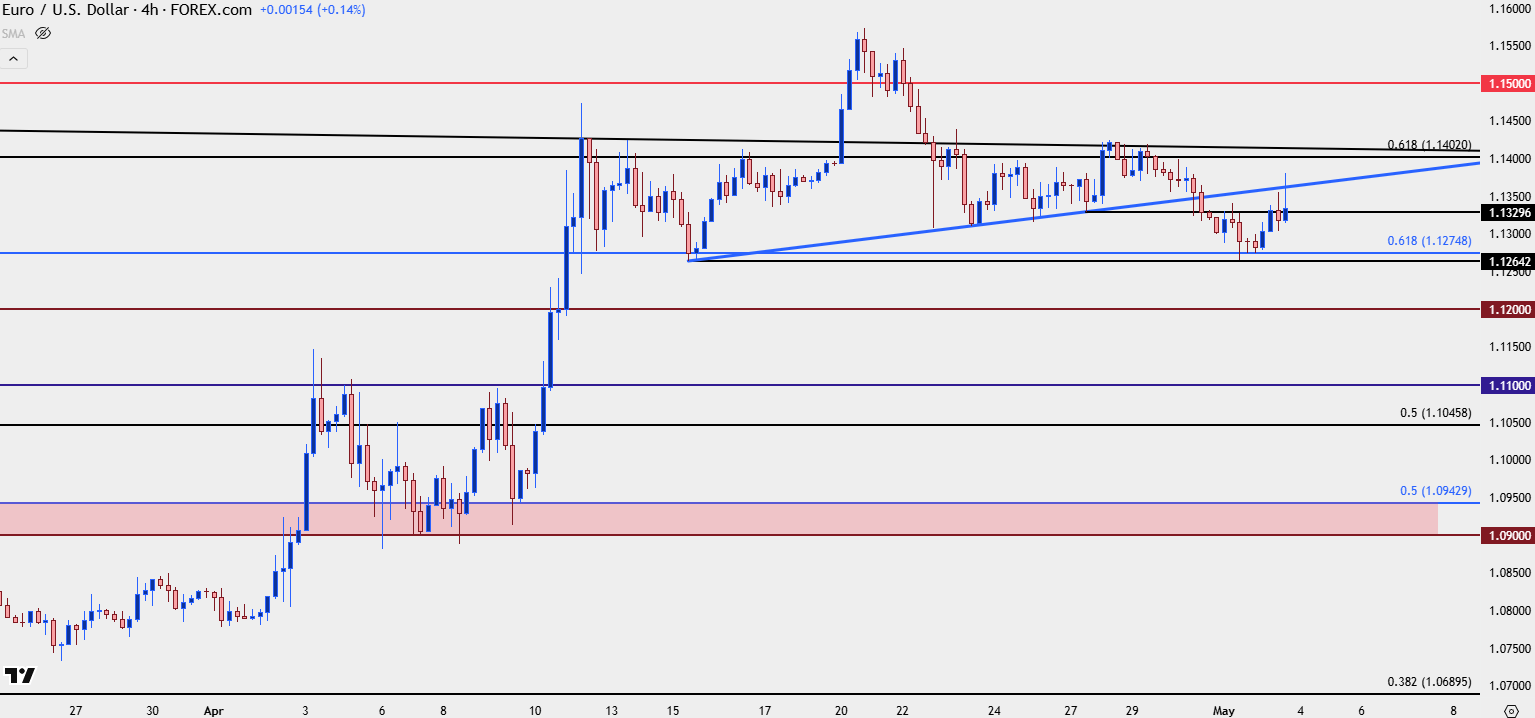 Chart prepared by James Stanley; data derived from Tradingview
USD/JPY
It was also a big week for USD/JPY with a Bank of Japan rate decision. The takeaway from that was a decisive push of JPY weakness with USD/JPY flying above the 145.00 level.
But this is one of those matters that intrigues both short and long-term forces, and I talked about this in the Thursday article. For longer-term longs that are still holding USD/JPY as driven by the carry trade, a rally above that 145.00 level becomes an invitation to close the position after a 500+ pip bounce. More important than trading above the 145.00 handle is actually staying above – indicating bullish momentum even above the major psychological level.
That hasn’t happened yet – although there has been a response to support from prior resistance at 144.00; so shorter-term price action is undeniably bullish from the two week sequencing of higher-highs and lows.
If the USD is to pose a larger reversal, USD/JPY holding higher-lows and pushing up to higher-highs will be a necessary component.

USD/JPY Daily Price Chart
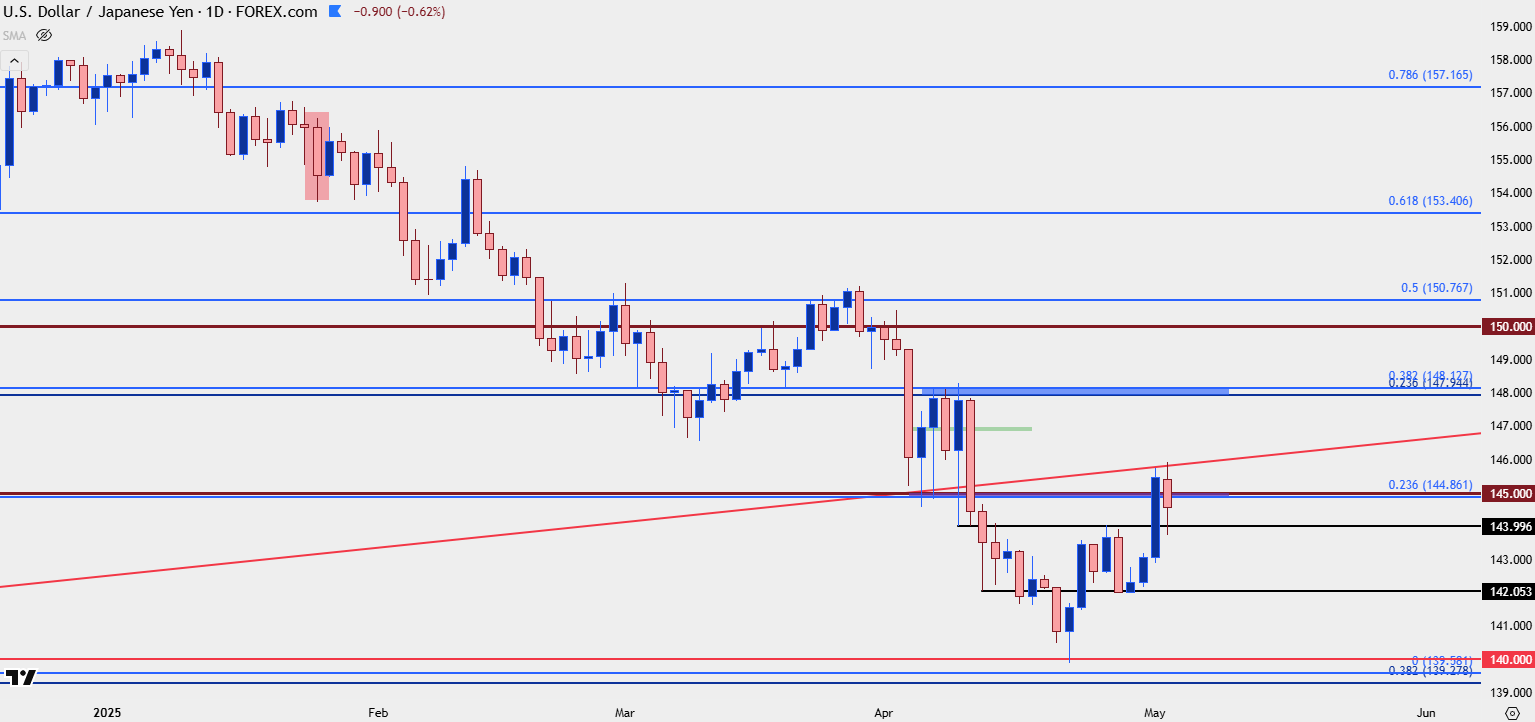 Chart prepared by James Stanley; data derived from Tradingview
GBP/USD
I’m including GBP/USD here because I’m a fan of the technical picture. I still do bias the pair towards USD-weakness scenarios with the same explanation that I had provided in the Tuesday webinar. And on the weekly chart, there’s now been two consecutive weeks of resistance at a major spot on the chart, around the 78.6% Fibonacci retracement of the 2021-2022 major move.
Given the two consecutive weeks of denial it seems presumptuous to assume bullish breakouts. But – it does highlight a couple of areas to look for pullbacks and higher-low support to lead into a topside setup. There are prior price swings at 1.3207, 1.3129 and then 1.3000 that all remain viable for higher-low support on this longer-term setup.
For those that want to avoid the USD, there’s the possibility of using this GBP-strength against relative Euro weakness elsewhere, such as against the Japanese Yen with EUR/JPY and GBP/JPY which I had looked at last week in anticipation of the BoJ rate decision.
GBP/USD Weekly Chart
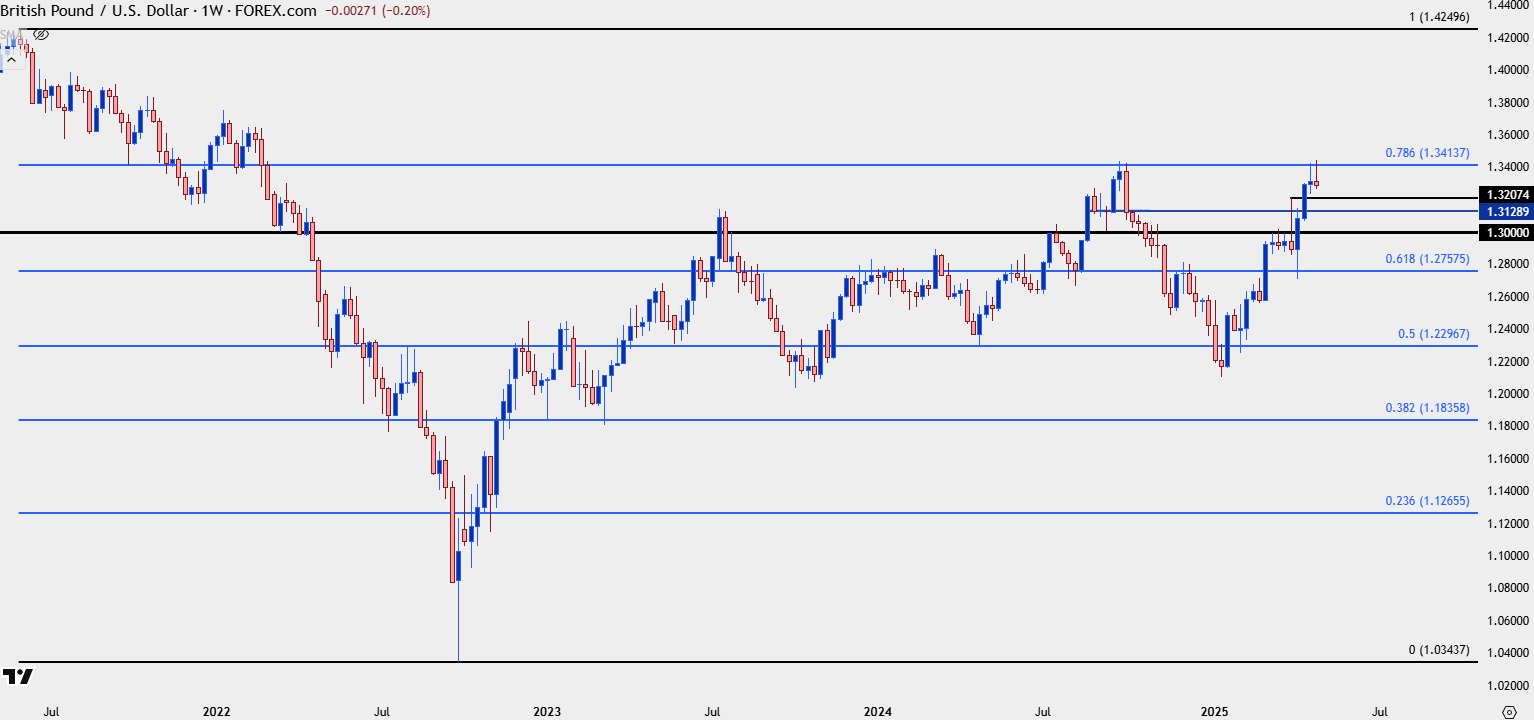 Chart prepared by James Stanley; data derived from Tradingview
--- written by James Stanley, Senior Strategist
Latest market news
September 18, 2025 02:48 PM
June 23, 2025 01:22 PM
June 23, 2025 10:39 AM
June 20, 2025 05:23 PM
June 20, 2025 04:46 PM
June 20, 2025 03:35 PM

May 14, 2024 01:20 AM
August 18, 2023 01:36 AM

August 17, 2023 11:05 PM

October 26, 2022 01:00 PM