

U.S. Dollar Talking Points:
- The US Dollar has found resistance at the 102 level looked at in last week’s webinar, and as I shared then, that set up opportunity for bears to defend the prior sell-off.
- Yesterday’s CPI report helped to fuel that pullback but we’ve since seen bulls show up to defend higher-low support.
- This sets the stage for a busy Thursday morning with retail sales, PPI and a speech from Chair Powell all on the calendar for before the U.S. equity cash open. EUR/USD remains of interest for USD-strength and as I looked at earlier on the day, USD/CAD is of attraction for USD-weakness scenarios.
- I’ll be looking at the USD from several vantage points in the weekly webinar, and you’re welcome to join. Click here to register.
I’m writing this just past the half-way point for the week and at this point, it’s been an indecisive outlay for the USD. There was significant strength on Monday, but then price paused just two pips below the 102 level and the CPI report yesterday fueled a pullback move. This sets the stage for an important Thursday morning outlay as we’ll get a glimpse at consumer behavior for the recently completed month via retail sales along with a look at a possible pre-cursor for inflation via PPI. Both reports release at 8:30 AM ET and then then minutes later we’ll get a speech from FOMC Chair Jerome Powell.
From the weekly chart of DXY we can gain some important context, as the 102 level has so far held resistance from the Monday rally, and the pullback has since held support at prior resistance, around 100.27.
If USD tanks tomorrow then the weekly bar can start to take on more of a shooting star shape, which after a rejection at resistance, would look prime for bears to make another run towards the lows. But – if the shorter-term trend can prevail and bulls can push back towards that 102.00 handle, then we’d have four consecutive green weekly bars which would point to a deeper topside move towards the 102.60 Fibonacci level.
U.S. Dollar Weekly Chart
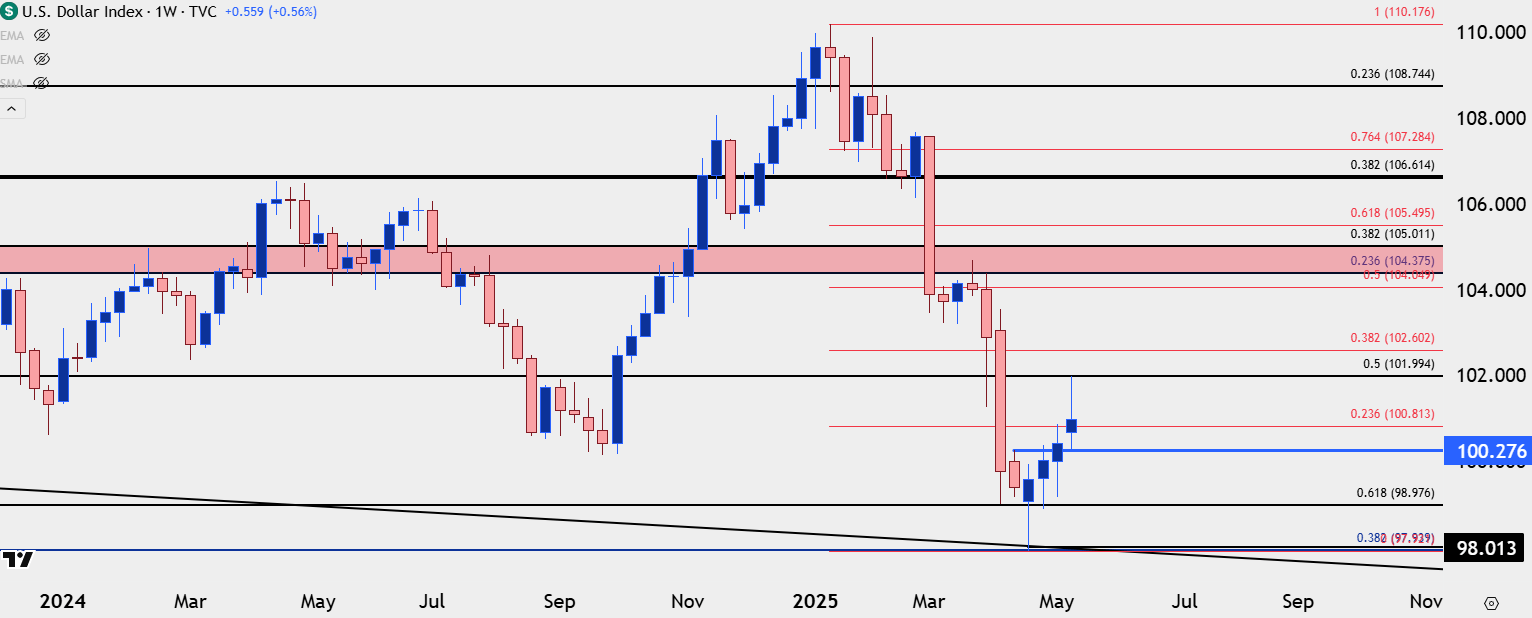 Chart prepared by James Stanley; data derived from Tradingview
USD Shorter-Term
From the four-hour chart we can see that support hold at prior resistance, which is around the neckline for the inverse head and shoulders pattern. That has helped to prod price back above the Fibonacci level at 100.81, and that keeps the door open for bulls; but that data outlay tomorrow will likely have a sizable impact on the matter.
Similar to what I had looked at on Monday, I still prefer USD-strength scenarios in EUR/USD with the recent build of bearish price action; while USD-weakness remains more attractive in USD/CAD, which I wrote about earlier this morning. USD/JPY is also in an interesting spot which I’ll explore further below.
U.S. Dollar Four-Hour Price Chart
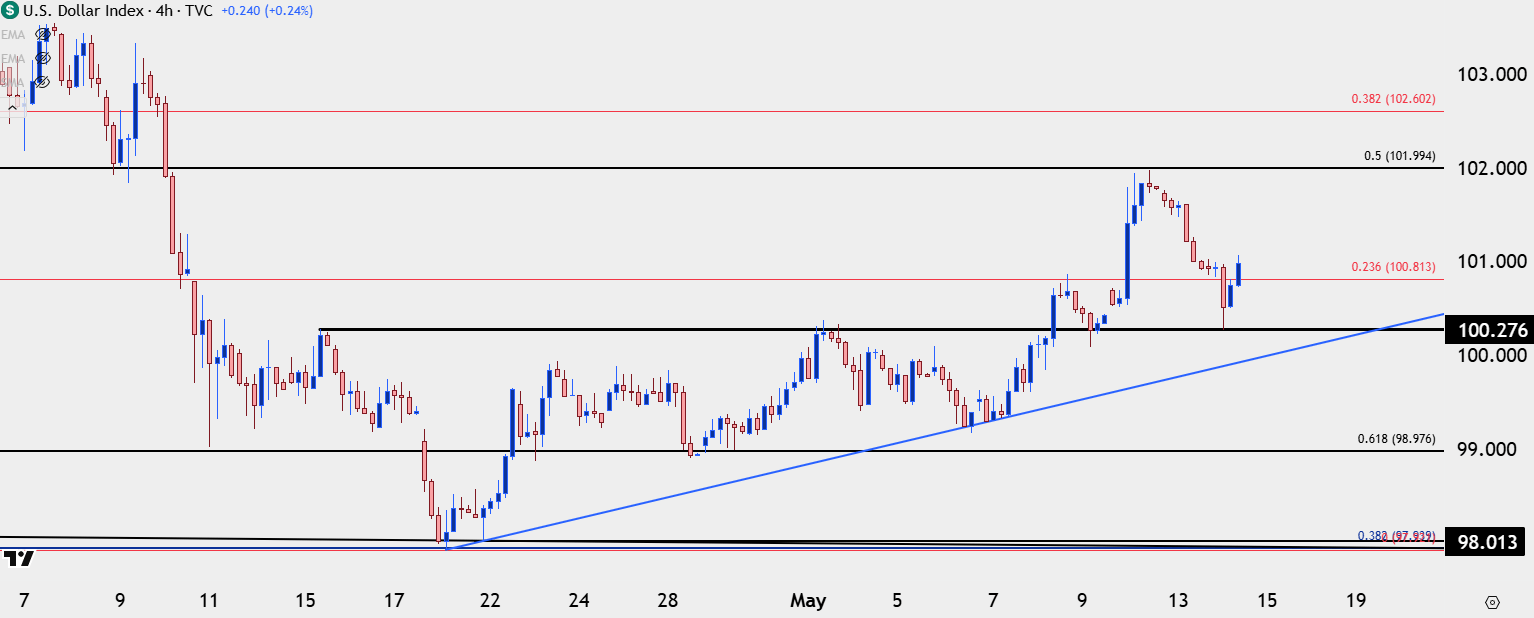 Chart prepared by James Stanley; data derived from Tradingview
EUR/USD
EUR/USD was in a hard breakdown on Monday and the pair even tested below the 1.1100 level, albeit temporarily. On Monday my concern was chasing the pair after a well-developed sell-off had already taken-over, and as I wrote in the article then, a pullback could re-open the door for bears.
Given prior support at 1.1200, that was an obvious level of interest, but there was also the prior support from the prior week with the descending triangle formation around 1.1275, and that’s what has so far held the highs today.

At this point, the daily bar of EUR/USD is taking the appearance of a tombstone or gravestone doji, which is indecisive but with a bearish tint given the upper wick. If sellers can push into the end of the day, this could end up taking on more of a shooting star pattern, which would be similar to the weekly bar in late-April that has, so far, marked the top for EUR/USD.
If USD strength is to continue it will likely need some help from EUR/USD bears pushing back to and perhaps even below the 1.1100 handle.
EUR/USD Daily Price Chart
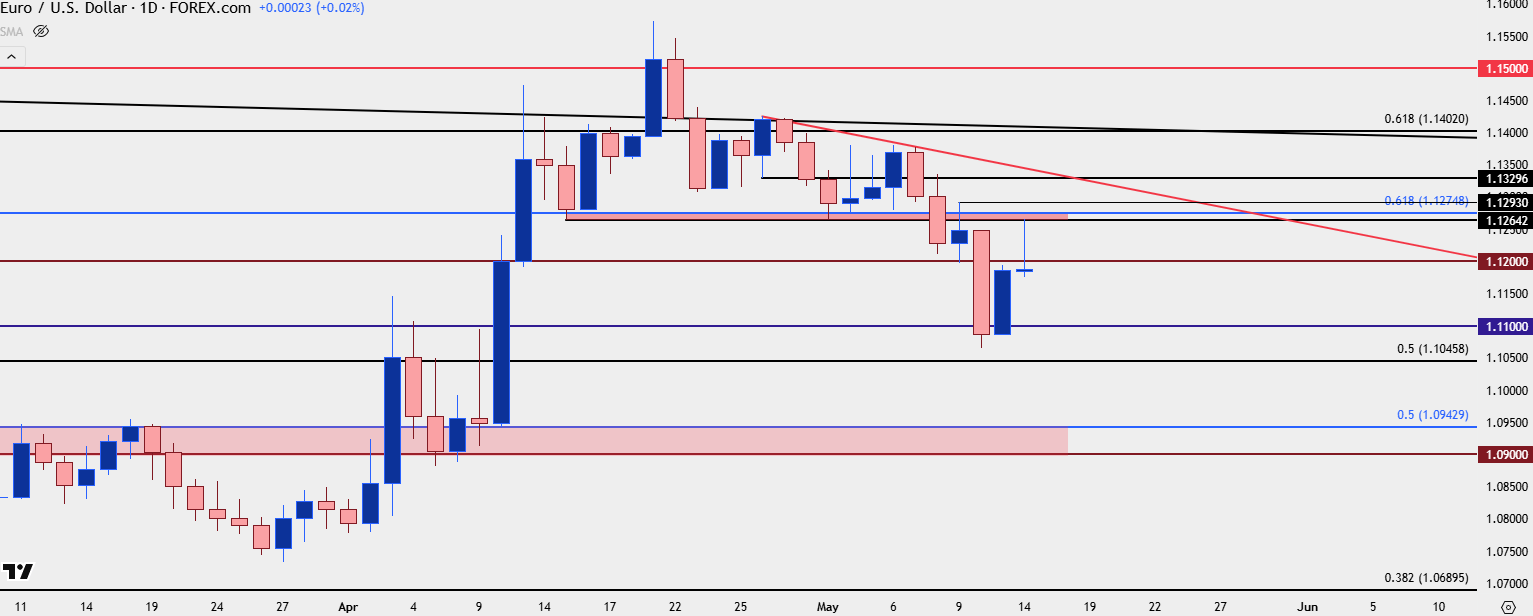 Chart prepared by James Stanley; data derived from Tradingview
U
SD/JPY
The Monday breakout in USD/JPY was significant as the pair went from a 145 support test on the prior Friday to above the 148 handle. As I said in the video then, it seems as though a lot of the push in USD is emanating from USD/JPY, moreso than the 13.6% clip of JPY in the DXY basket. But, also important is trying to avoid chasing the Yen as the currency has been prone to traps – on both sides- at varying times throughout the year.
Well, the pair put in a sizable pullback and the 145.92 level of prior resistance has, so far, held as support. That level has held the pullback and there’s also a longer-term trendline in-play, which had held the highs in the pair both after the BoJ rate decision two weeks ago and the FOMC rate decision last week.
This keeps the door open for a push up to the psychological level of 147.50 after which the Fibonacci level of 148.13 comes into play.
USD/JPY Four-Hour Price Chart
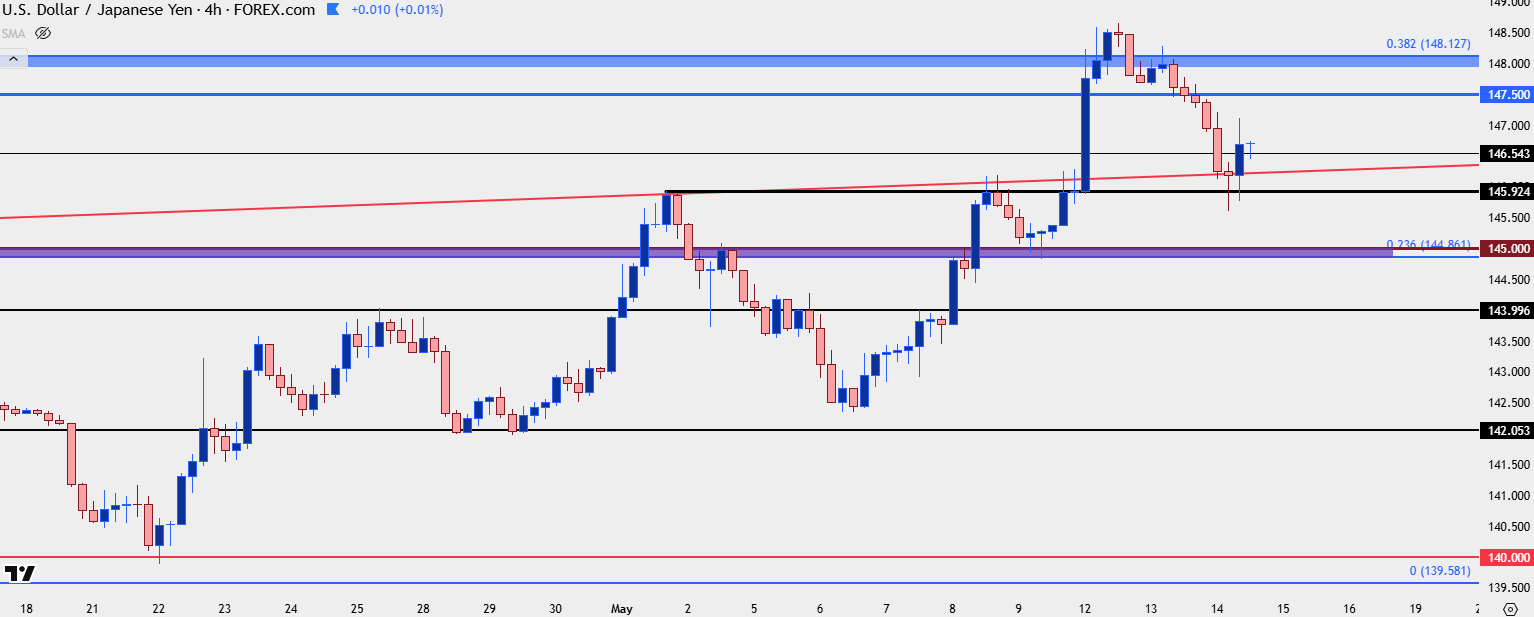 Chart prepared by James Stanley; data derived from Tradingview

From the daily chart, the recovery theme in USD/JPY remains in-place as there’s been a build of higher-highs and lows. This puts a lot of emphasis on the data on tomorrow’s calendar and if USD bulls can retain control, and USD/JPY can continue the recent rally, the 150.00 handle and the 200-day moving average loom overhead as the next significant spots of resistance.
USD/JPY Daily Chart
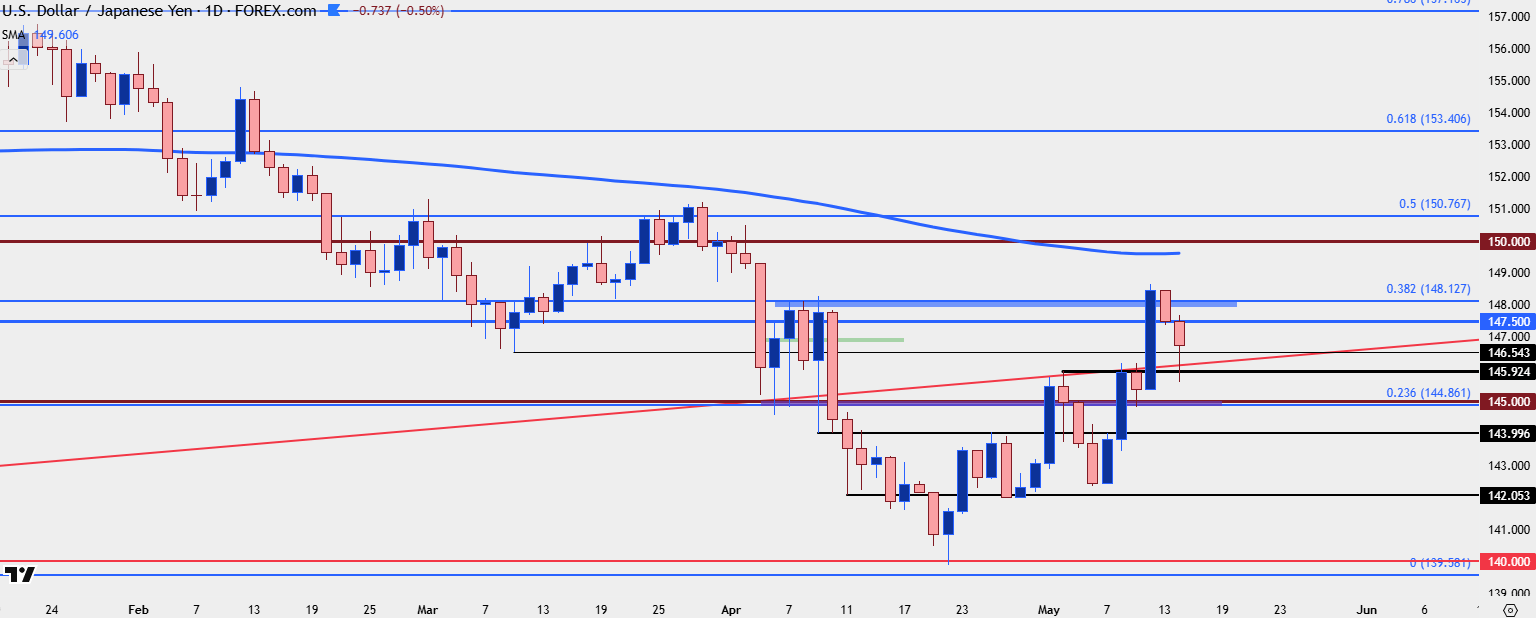 Chart prepared by James Stanley; data derived from Tradingview
--- written by James Stanley, Senior Strategist
Latest market news
September 18, 2025 02:48 PM
June 23, 2025 01:22 PM
June 23, 2025 10:39 AM
June 20, 2025 05:23 PM
June 20, 2025 04:46 PM
June 20, 2025 03:35 PM

September 18, 2025 02:48 PM

June 18, 2025 08:37 PM

June 13, 2025 06:22 PM

June 12, 2025 03:40 PM