

Key Events
- USDCAD extends its rebound from the 1.38 support zone following the FOMC outlook
- Bitcoin climbs back above the 100,000-mark amid rising uncertainty
- The U.S. Dollar seems to have priced in recent soft economic data, with markets now tracing short-term reversal patterns
- Upcoming insights from FOMC members and next week’s U.S. CPI release may serve as the next key market-moving catalysts
Despite a series of negative U.S. economic indicators, Fed Chair Jerome Powell noted in Wednesday’s FOMC meeting that the data is not sufficient to warrant alarm or consider a rate cut just yet. Consequently, FX markets remain under pressure near key resistance levels, while the DXY posts a bullish rebound back above the critical 100.30 mark.
From a momentum perspective, markets appear poised for a short-term rebound against the U.S. dollar before committing to a clearer directional move for the remainder of 2025. Meanwhile, haven demand for gold appears to be undergoing a bearish reversal, cooling off an overheated momentum phase. That demand seems to be rotating into Bitcoin, which has reclaimed the psychological 100,000 threshold.

DXY is Back Above 100: 5-Hour Time Frame – Log Scale
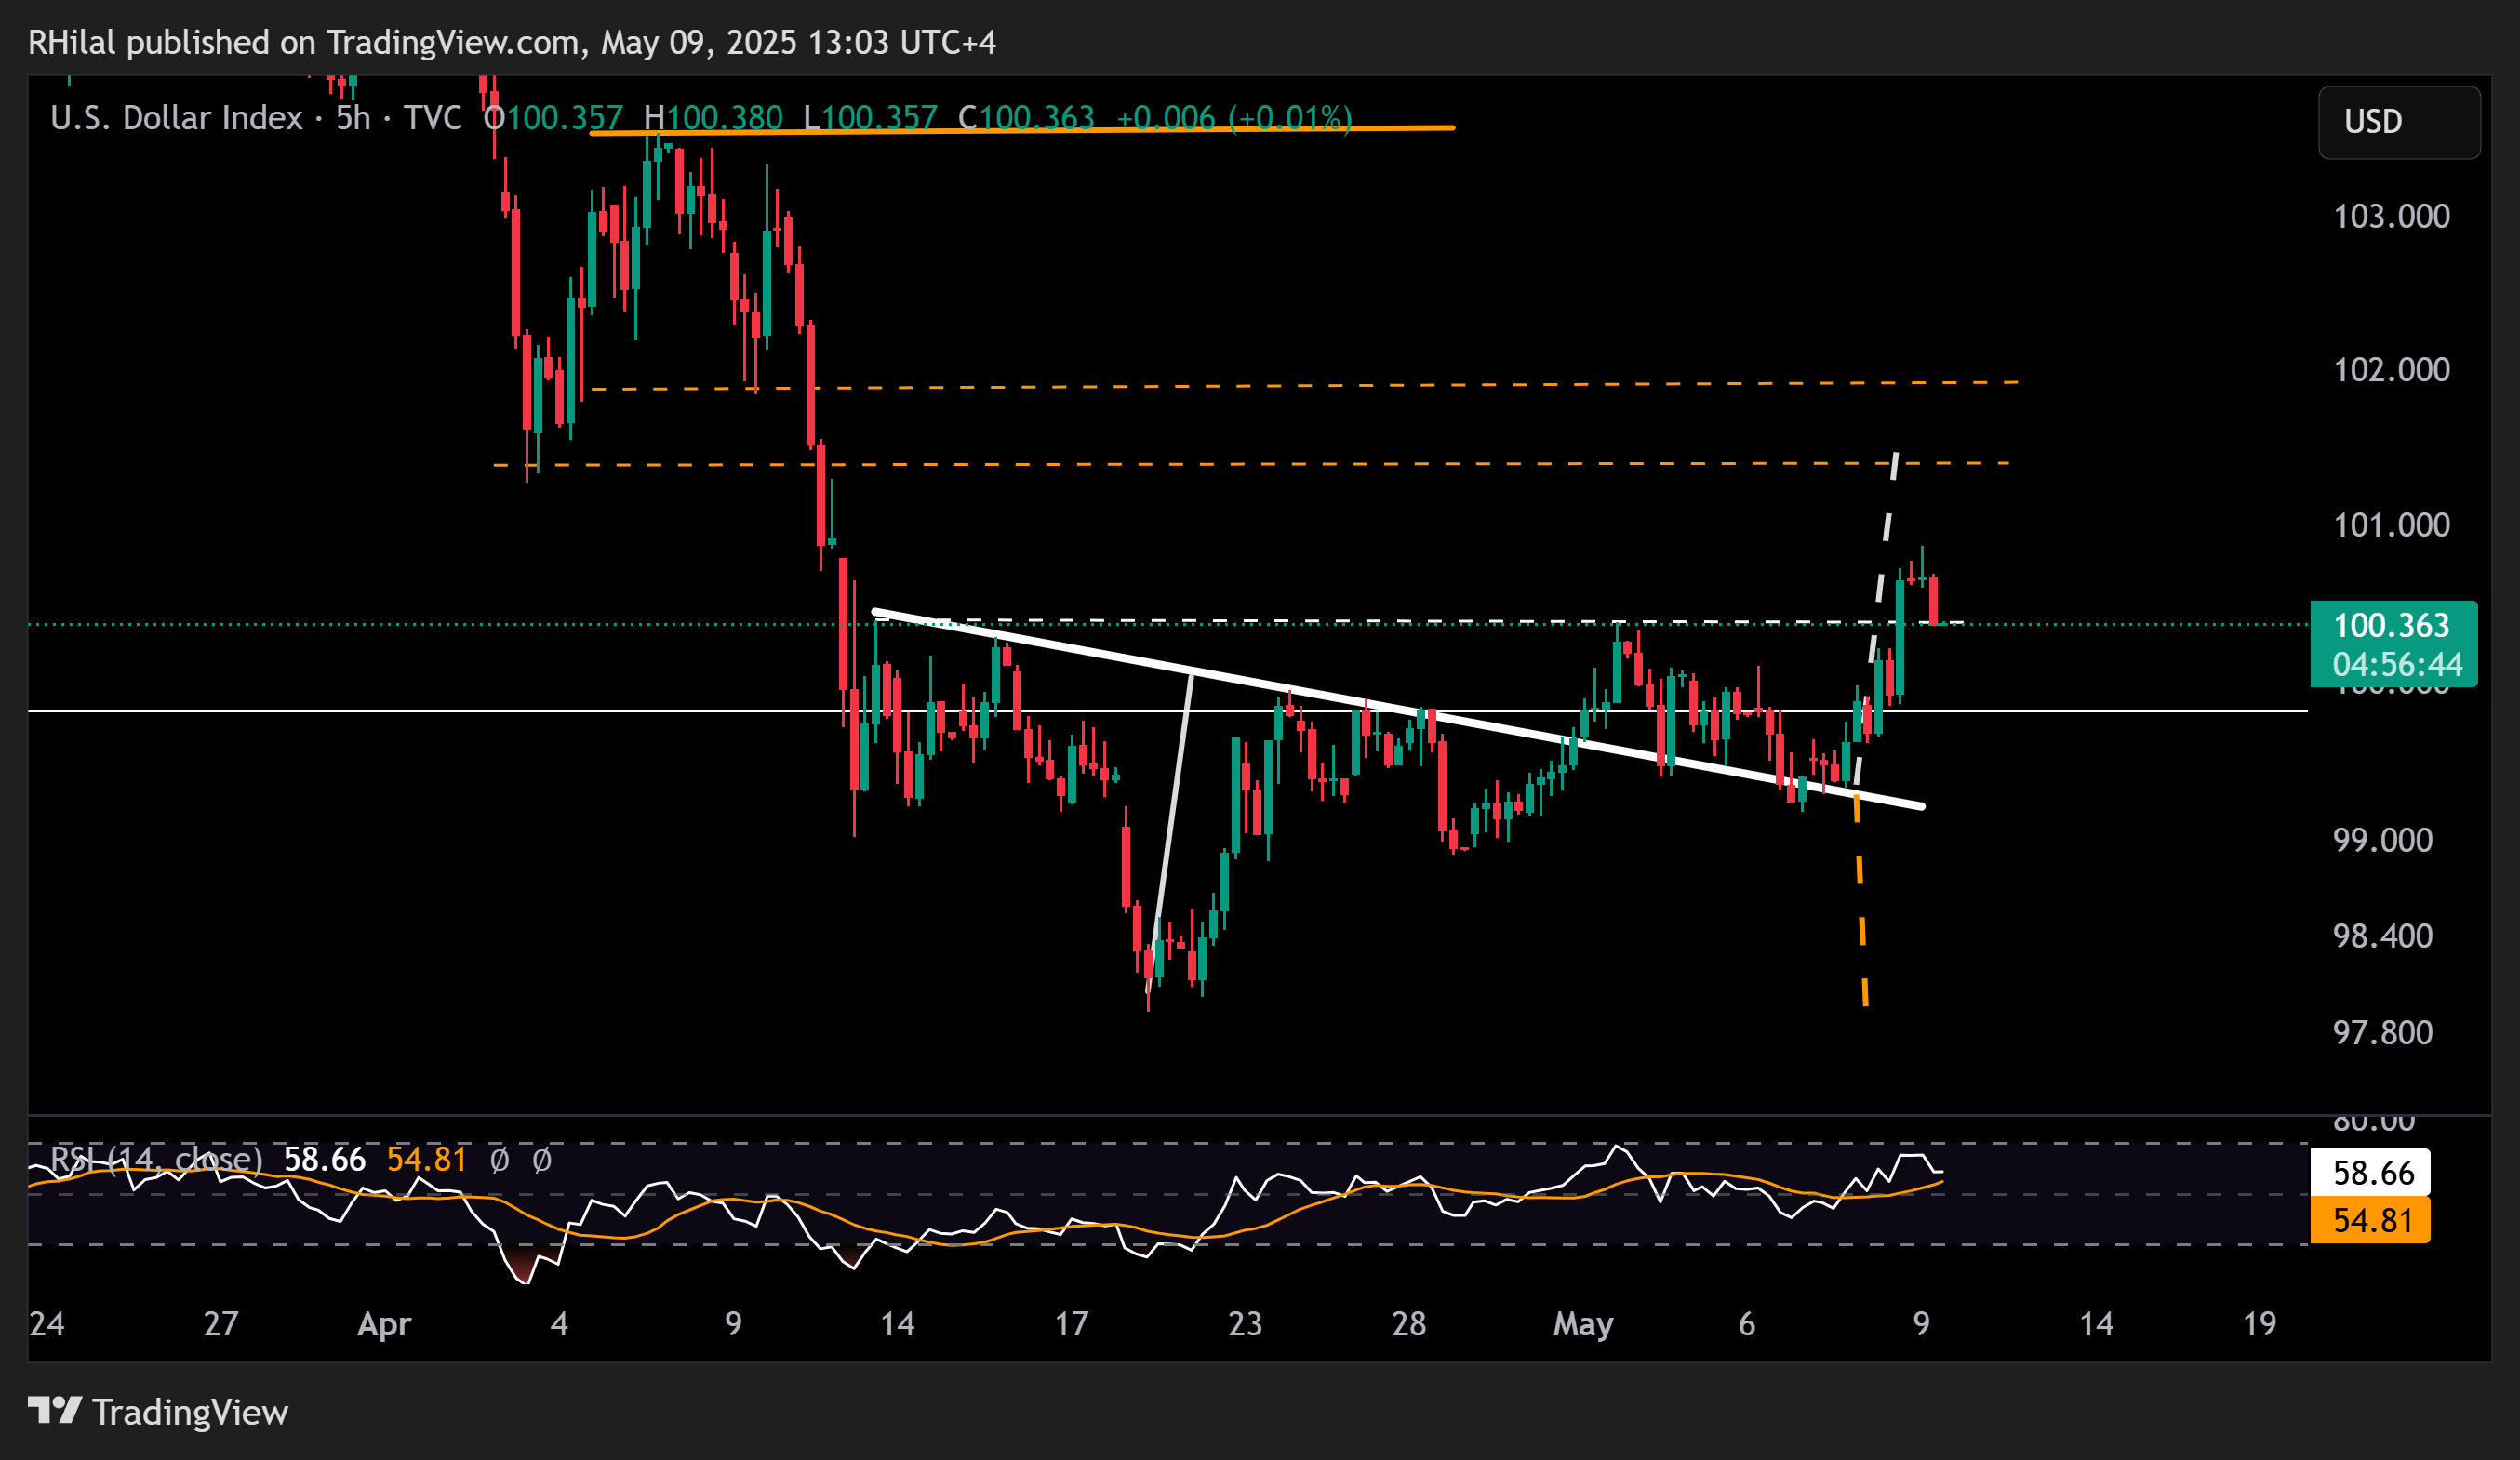
Source: Tradingview
The DXY is tracing a choppy breakout out of an inverted head and shoulders pattern, reclaiming the 99 and 100.30 levels. In response:
- EURUSD has slipped below 1.13
- GBPUSD has dropped back under 1.33
- These movements reflect potential short-term market reversals.
Meanwhile, USDCAD is climbing from the 1.38 support, and Bitcoin is emerging as both a bullish and safe-haven favorite, soaring above the 100,000 level.
USDCAD Outlook: 3-Day Time Frame - Log Scale
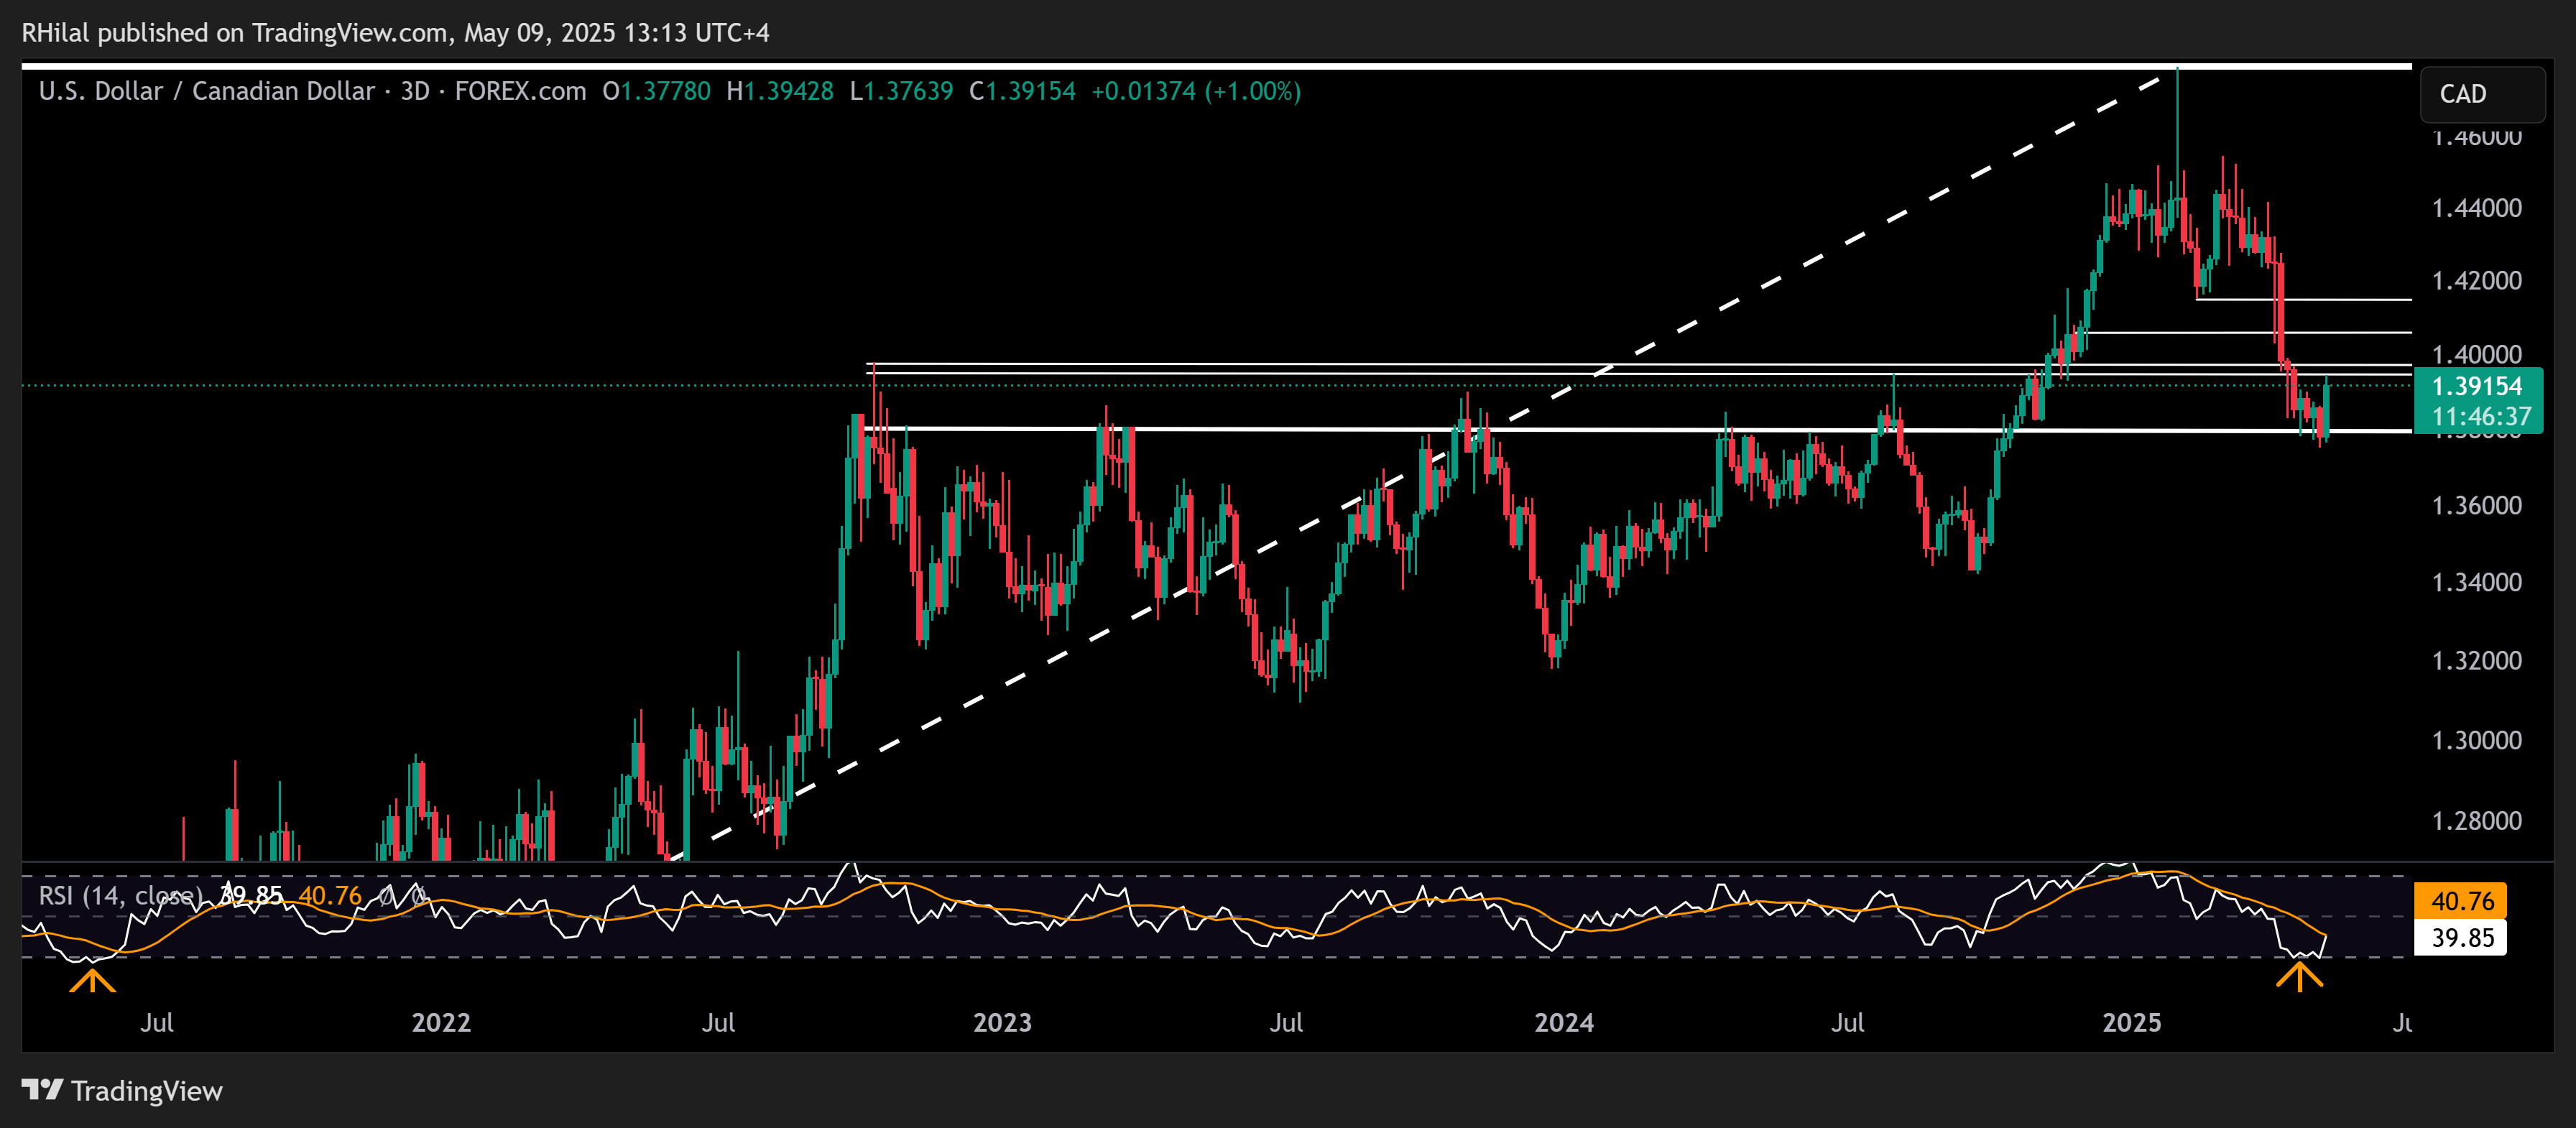
Source: Tradingview
In line with a momentum rebound from oversold levels last seen in May 2021, and supported by the DXY’s bullish reversal pattern, the USDCAD pair managed to climb back above the 1.39 mark.
It now faces Fibonacci resistance levels corresponding to the retracement of the downtrend between February and May 2025 at 1.3940, 1.4050, and 1.4150. On the downside, if the pair fallback below 1.3750, risks may extend toward the September 2024 lows at 1.34.

Bitcoin Outlook: Weekly Time Frame – Log Scale
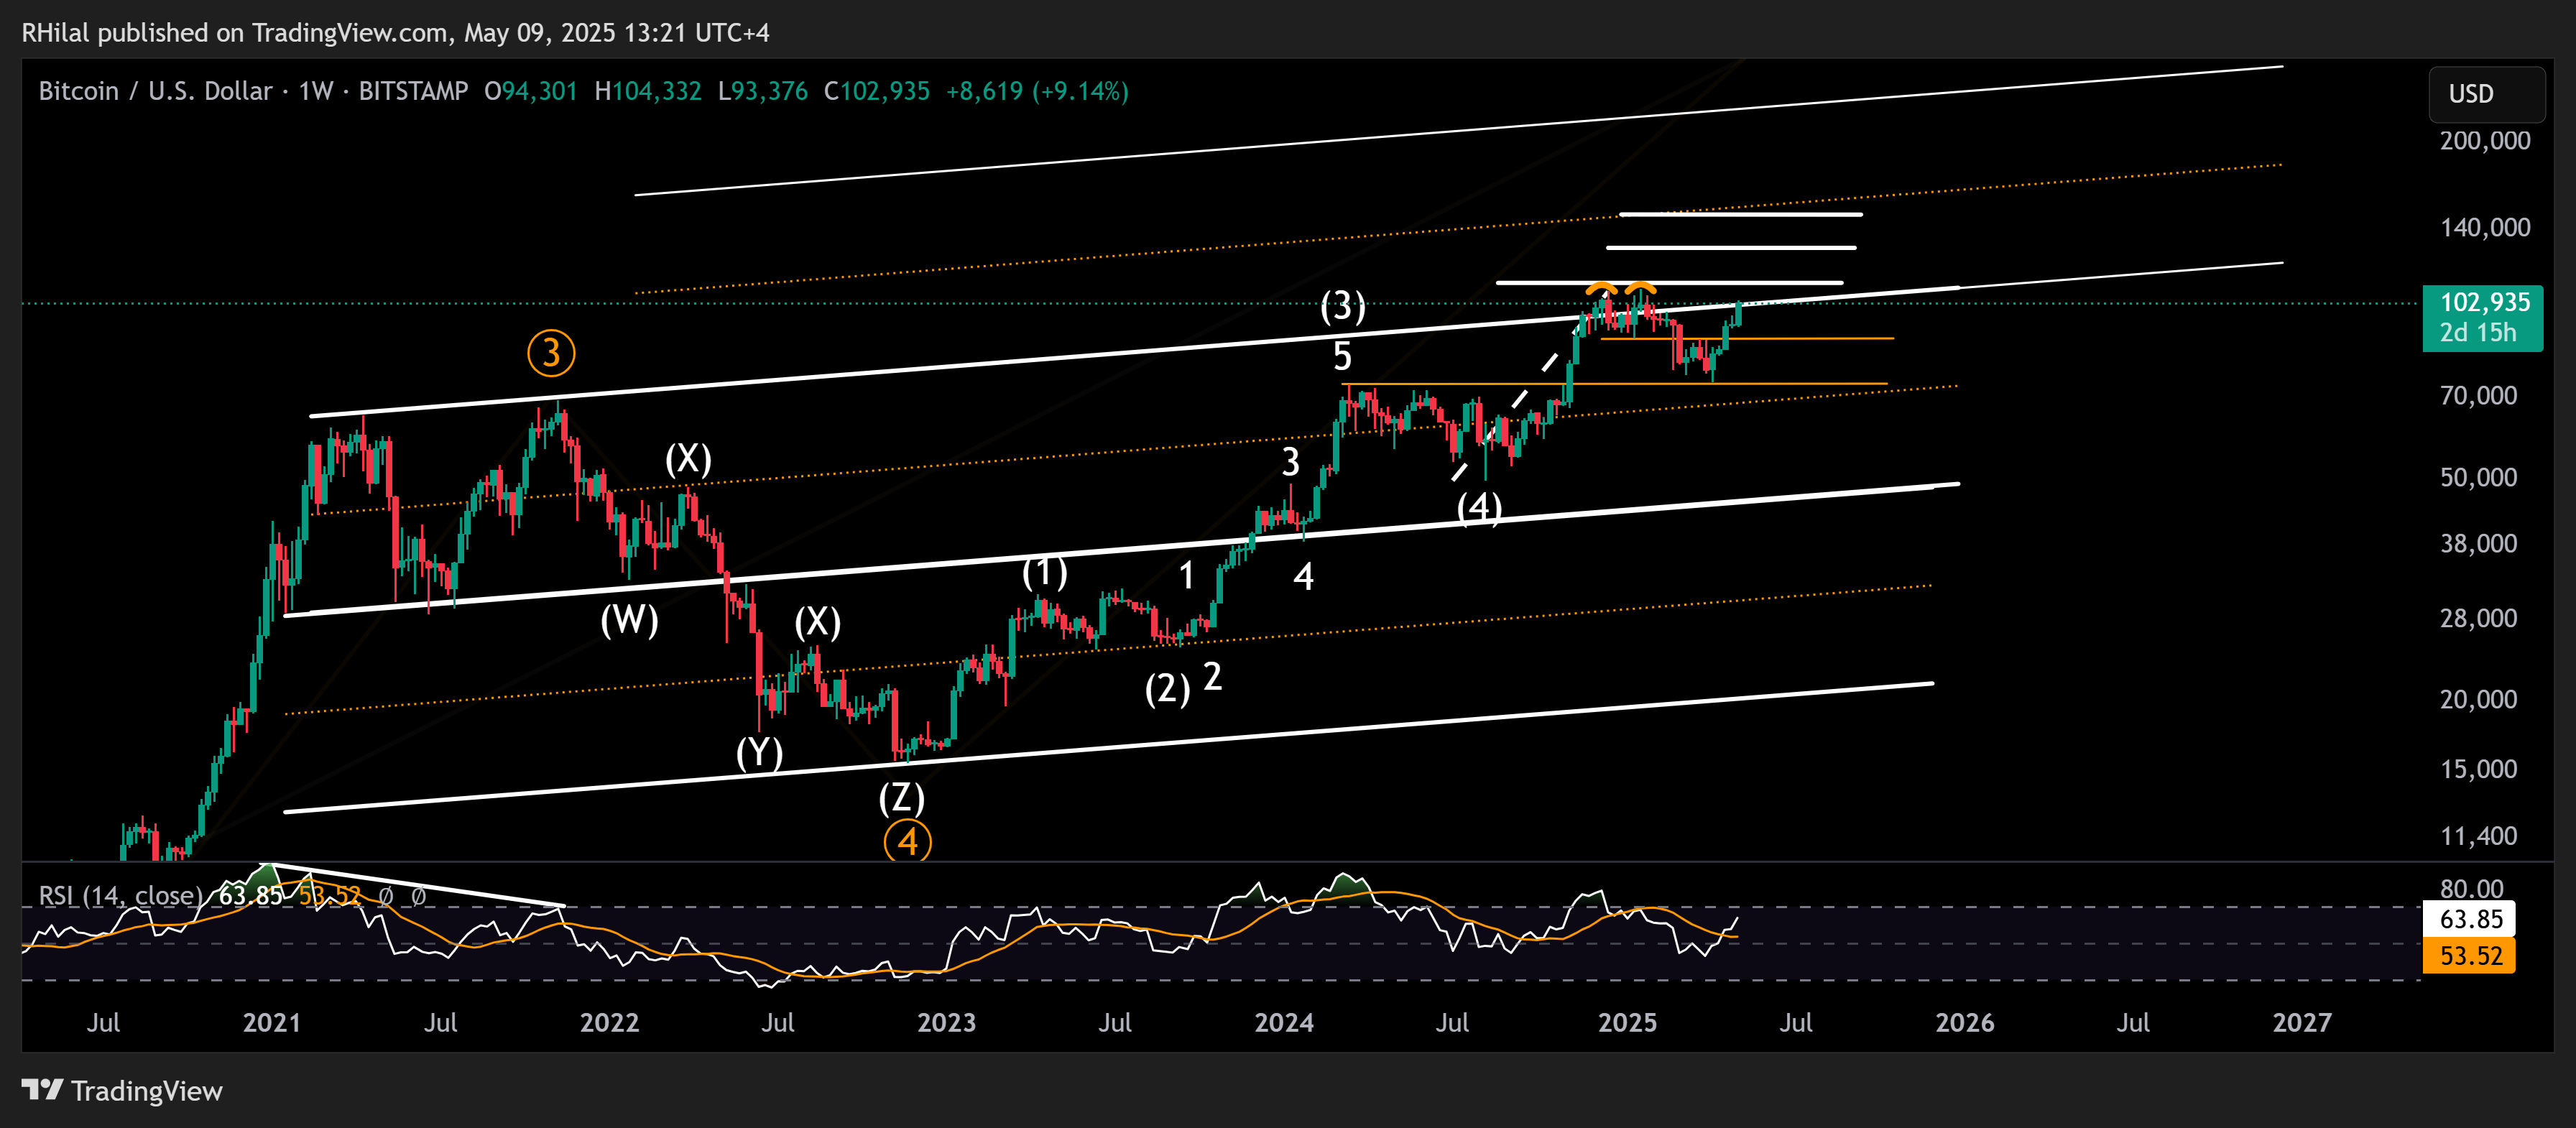
Source: Tradingview
Looking at the Bitcoin chart from the perspective of the April–November 2021 trendline, we’re back at the same resistance zone that triggered a 30,000-point drop. The current test of the 112,000-resistance zone is critical before confirming a possible extension toward new record highs at 130,000 and 150,000.
To the downside, if Bitcoin reverses below the 93,000 level, support may come in at 89,000, 79,000, and 74,000, respectively.
Given Bitcoin’s positioning as a treasury reserve asset — and its political support under the Trump administration — dips may attract further buying interest. A clean breakout above 112,000 could pave the way for a rapid move toward new record highs.
Written by Razan Hilal, CMT
Follow on X: @Rh_waves
Latest market news
Yesterday 07:00 AM
May 23, 2025 06:26 PM
May 23, 2025 04:30 PM
May 23, 2025 02:42 PM
May 23, 2025 02:05 PM
May 23, 2025 12:42 PM

May 13, 2025 03:15 PM

May 9, 2025 10:43 AM

March 11, 2025 03:36 PM
March 3, 2025 06:03 PM