

View related analysis:
- ASX 200, Dow Jones Technical Analysis: Resistance Levels in Focus
- USD/JPY, GBP/JPY Technical Outlook: BOJ Inaction Weighs on Japanese Yen
- USD/JPY, USD/CHF, EUR/USD Analysis: USD Reversal Grinds Away
USD/CAD Technical Analysis: US Dollar vs Canadian Dollar
I have been patiently waiting for USD/CAD to retrace higher, and I suspect we’re now an important step closer to a bounce. USD/CAD printed an elongated bearish candle three weeks ago, and volatility has diminished significantly in the subsequent candles. An inverted hammer formed two weeks ago, followed by last week’s doji. USD/CAD is now clearly trying to hold above the November low (1.3822) and the September VPOC (volume point of control). The weekly RSI (2) has also been oversold for several weeks.
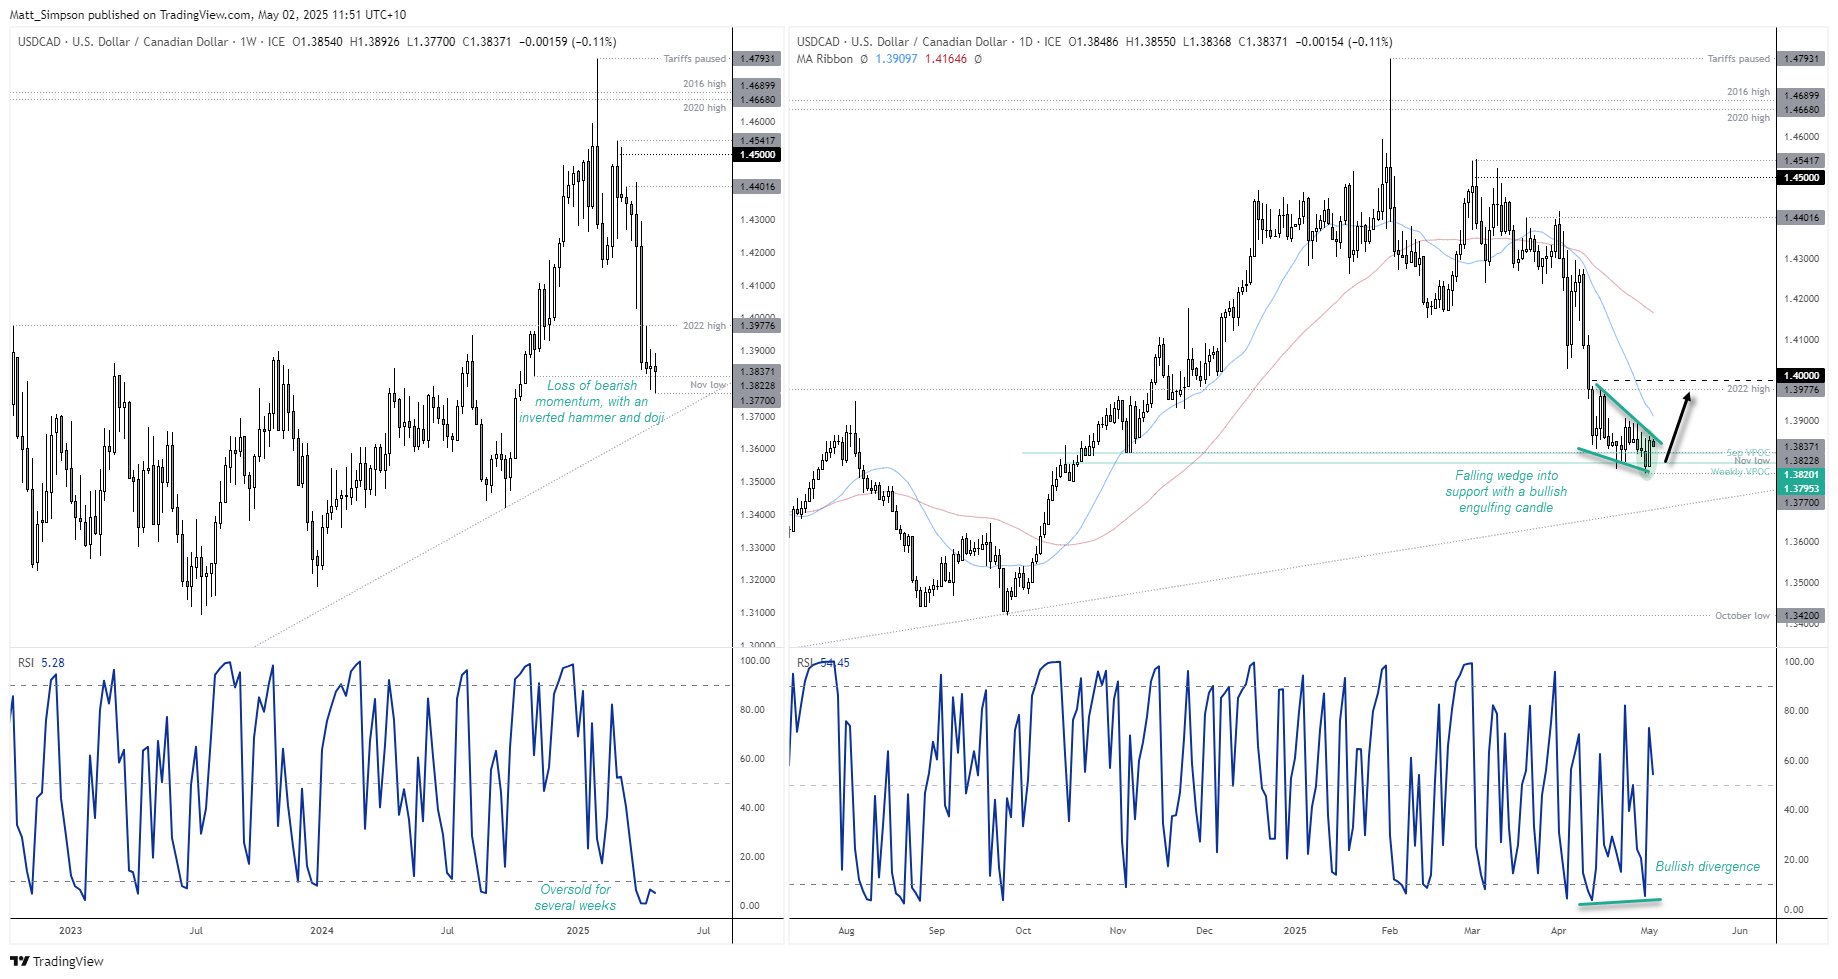
USD/CAD Daily Chart: On Standby for a Bounce
The daily chart shows a falling wedge on USD/CAD, which is considered a bullish reversal pattern during a downtrend. A traditional method of using its base as a target suggests a move up to the 2022 high of 1.3977, just beneath the 1.40 handle. Also note a bullish divergence that has formed on the daily RSI (2) in recent weeks, and the RSI suggests the indicator itself formed a cycle low in the oversold zone last week. Furthermore, a bullish engulfing candle formed on Thursday, following a false break of a historical weekly VPOC (volume point of control) on Wednesday.
Bulls could seek dips within Thursday’s range and maintain a bullish bias while prices remain above this week’s low (1.3770).

GBP/USD Technical Analysis: British Pound vs US Dollar
The British pound (GBP/USD) has so far risen 3% this quarter—for the second quarter in a row. Yet resistance has been met around the September high. A bearish pinbar also formed last week, with the weekly RSI (2) in overbought territory, and if GBP/USD closes the week near current levels, it will have formed another bearish pinbar. If two wrongs don’t make a right, perhaps two bearish pinbars don’t make much of a bullish case over the near term.
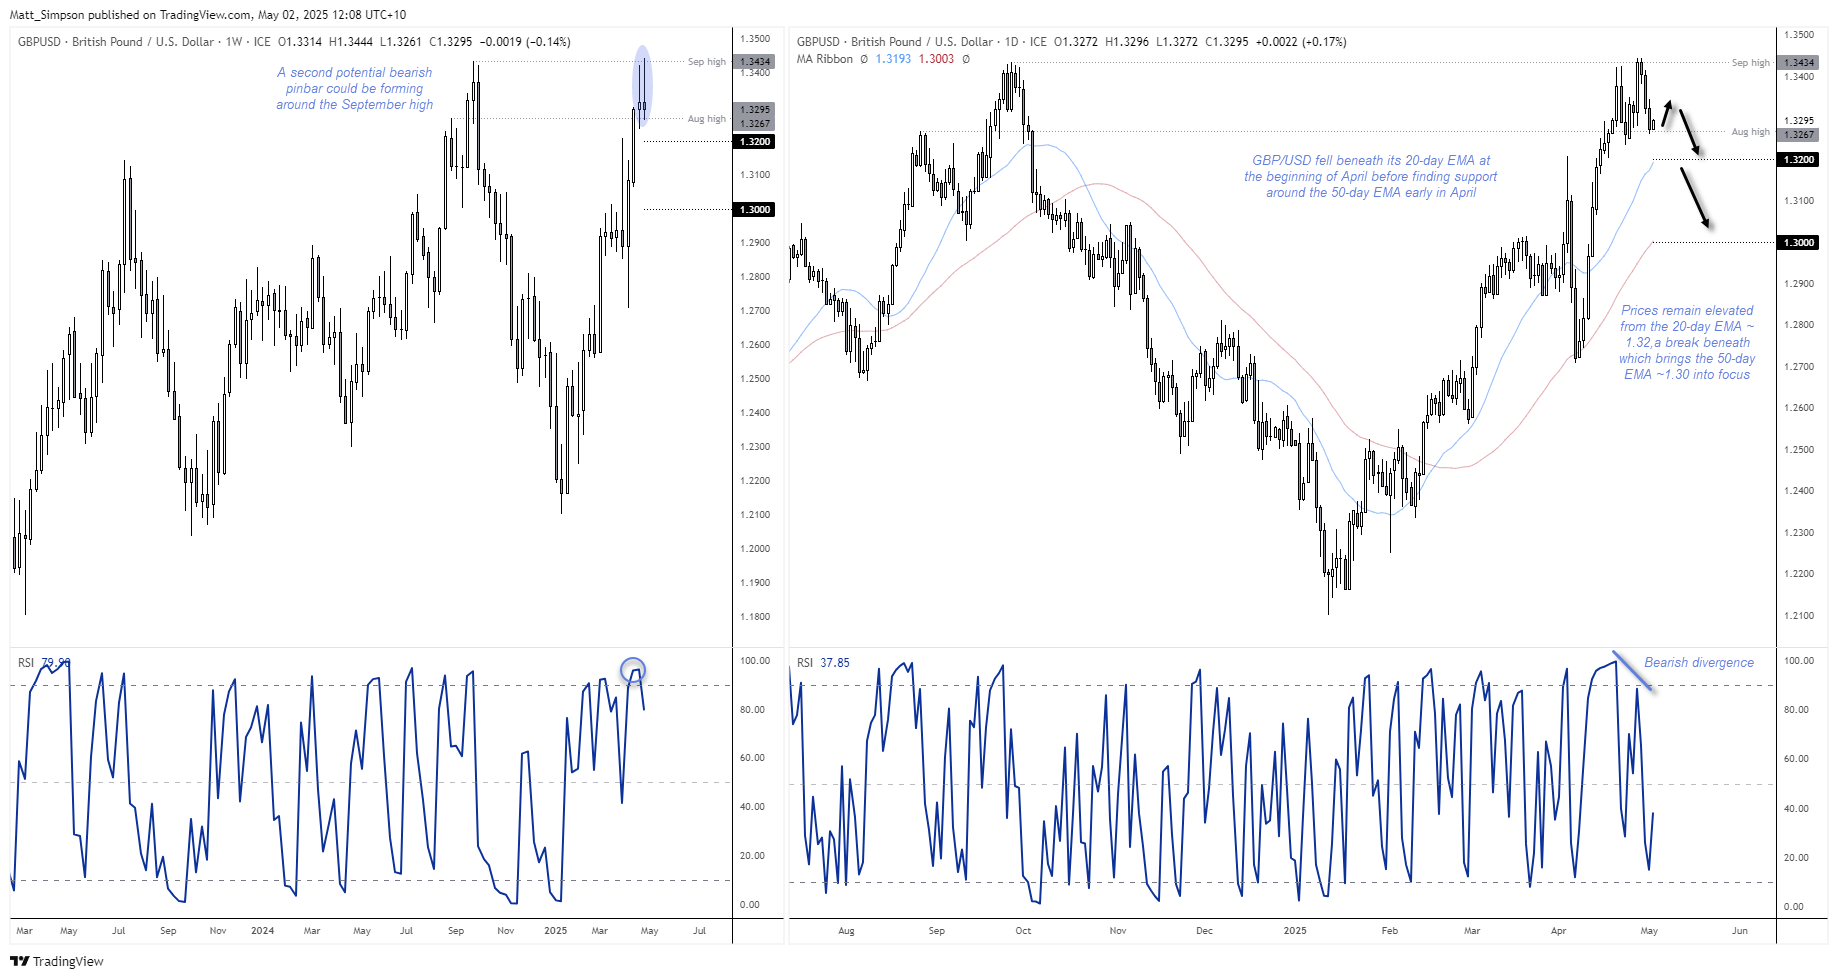
GBP/USD Daily Chart: Pound’s Mean Reversion Could Still be in Play
The daily chart shows a clear uptrend on GBP/USD, though bears have driven the pound lower for a third day. It also remains elevated compared to its 20-day and 50-day EMAs.
While support has been found at the August high (1.3367) for now, I doubt this correction is over yet. And despite the strong bullish trend structure on GBP/USD, it still fell quite far beneath hits 20-day EMA at the beginning of April before finding support at the 50-day EMA around 1.27. If a similar move were to unfold, GBP/USD could be headed for the 20-day EMA around 1.32, a break beneath which brings the 50-day EMA into focus around 1.30.

Gold Futures (GC) Technical Analysis
Nobody can say that gold bugs have not given gold’s rally a damn good go. But the last push to $3500 clearly proved too much for even gold’s liking, and a correction is clearly underway. Although with gold already down -8.5% in just seven days, bears may need to pause for breath over the near term.
The daily chart shows that Thursday’s low held above the April high and that prices have gapped higher at today’s open to suggest some bullish mean reversion against yesterday’s selloff is underway.

Gold Futures (GC) 1-Hour Chart
Support was found perfectly at the weekly S1 pivot (3210), and prices are now moving towards the monthly pivot point (3266). Given this is near the April low (3270), the 3266–3270 area becomes an important resistance zone over the near term.
If bears regain control and keep prices beneath that zone, the broader bearish pattern remains intact. The descending triangle projects a downside target around 3158, though bears will first need to break key support levels around 3200 (April high and weekly S1 pivot). If they succeed, the 61.8% Fibonacci retracement level at 3176 comes into play ahead of the triangle’s target.
However, the triangle pattern is invalidated with a break above 3280. That could entice gold bulls back into the market, potentially forcing a move toward the intraday highs around 3330–3340 or the weekly pivot point near the 3363 high.
Given the rising wedge forming just below resistance on the 1-hour chart, my bias is for the descending triangle to play out and for gold to undergo a deeper correction.
-- Written by Matt Simpson
Follow Matt on Twitter @cLeverEdge
Latest market news
September 18, 2025 02:48 PM
June 23, 2025 01:22 PM
June 23, 2025 10:39 AM
June 20, 2025 05:23 PM
June 20, 2025 04:46 PM
June 20, 2025 03:35 PM

June 20, 2025 05:20 AM
June 20, 2025 04:38 AM

June 20, 2025 12:39 AM

June 19, 2025 11:09 PM