

USD/CAD has been showing neutral price action in the short term. Over the last five sessions, price fluctuations have barely reached a 0.5% variation, as the pair continues hovering around a key barrier near the 1.43289 level. This calm occurs amid new developments regarding the trade war and recent moves from central banks.

Trump’s Tariffs
For over a month, the Trump administration has firmly pointed to April 2 as the date when all previously announced tariffs will officially take effect. This includes a 25% tariff on goods from Canada and Mexico, measures that have been mentioned repeatedly in recent weeks.
However, once again, the U.S. President has shown some flexibility, stating that tariffs may not be enforced on that date, offering additional negotiation time to the affected countries. He also mentioned the potential implementation of new tariffs on products from other countries, adding further uncertainty to the outlook.
In short, it is still unclear whether Canada and Mexico will face tariffs at the beginning of April. This has given the market a temporary breather, especially for the Canadian dollar, which has avoided weakening in the short term. However, if the White House resumes a tougher stance, downward pressure on the CAD could return, potentially driving USD/CAD higher through renewed bullish momentum on the U.S. dollar.
Central Banks
In recent weeks, the Bank of Canada (BoC) and the Federal Reserve (FED) have adopted contrasting positions. On March 12, the BoC took a dovish stance, stating that economic uncertainty justifies lower rates in the medium term.
By contrast, during its March 20 meeting, the FED indicated that inflation remains well above the 2% target, choosing to keep rates unchanged at 4.25% – 4.5%, reflecting a firm but neutral position.
Currently, the interest rate gap between the two central banks stands at 4.5% for the FED and 2.75% for the BoC, which represents a notable divergence in monetary policy decisions.
BOC vs. FED: Rate Comparison
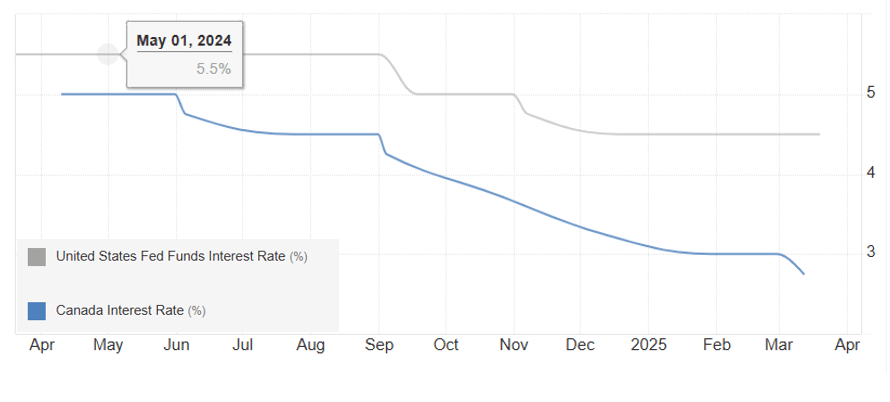
Source: Tradingeconomics
Looking ahead to the May 7 meeting, the FED is expected to keep rates stable, with a probability of 89.8%, according to CME Group data. This reinforces the FED’s neutral tone for the coming months.
FED Rate Probability Table – CME
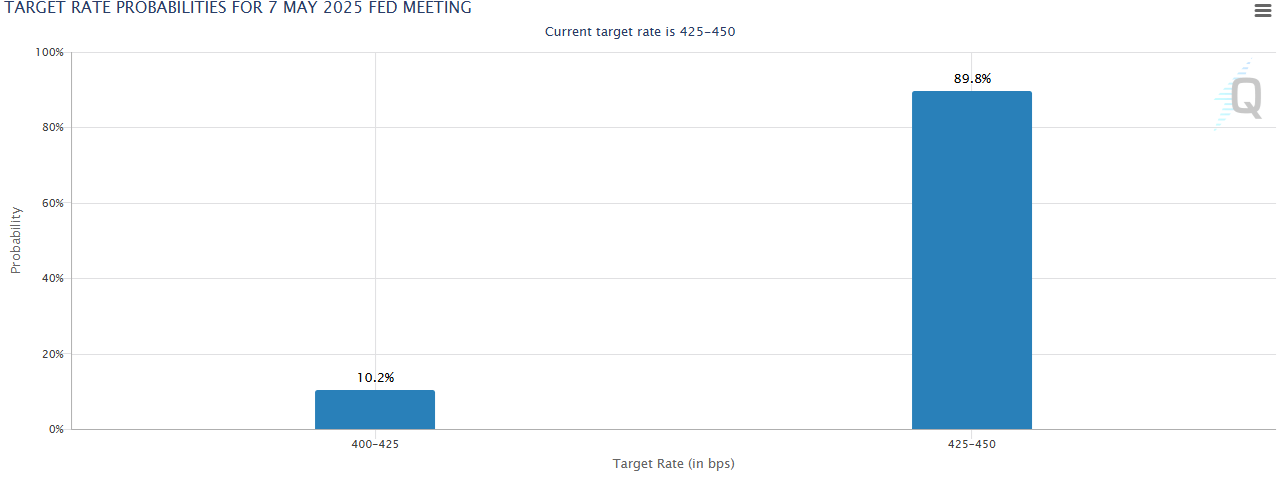
Source: CMEGroup
This rate gap and policy divergence could be crucial for USD/CAD. A higher and stable rate in the U.S. could continue to attract capital to U.S. fixed-income securities, reducing the appeal of Canadian assets. As a result, demand for the U.S. dollar could increase, limiting the strength of the Canadian dollar and sustaining bullish pressure on USD/CAD.
USD/CAD Technical Outlook
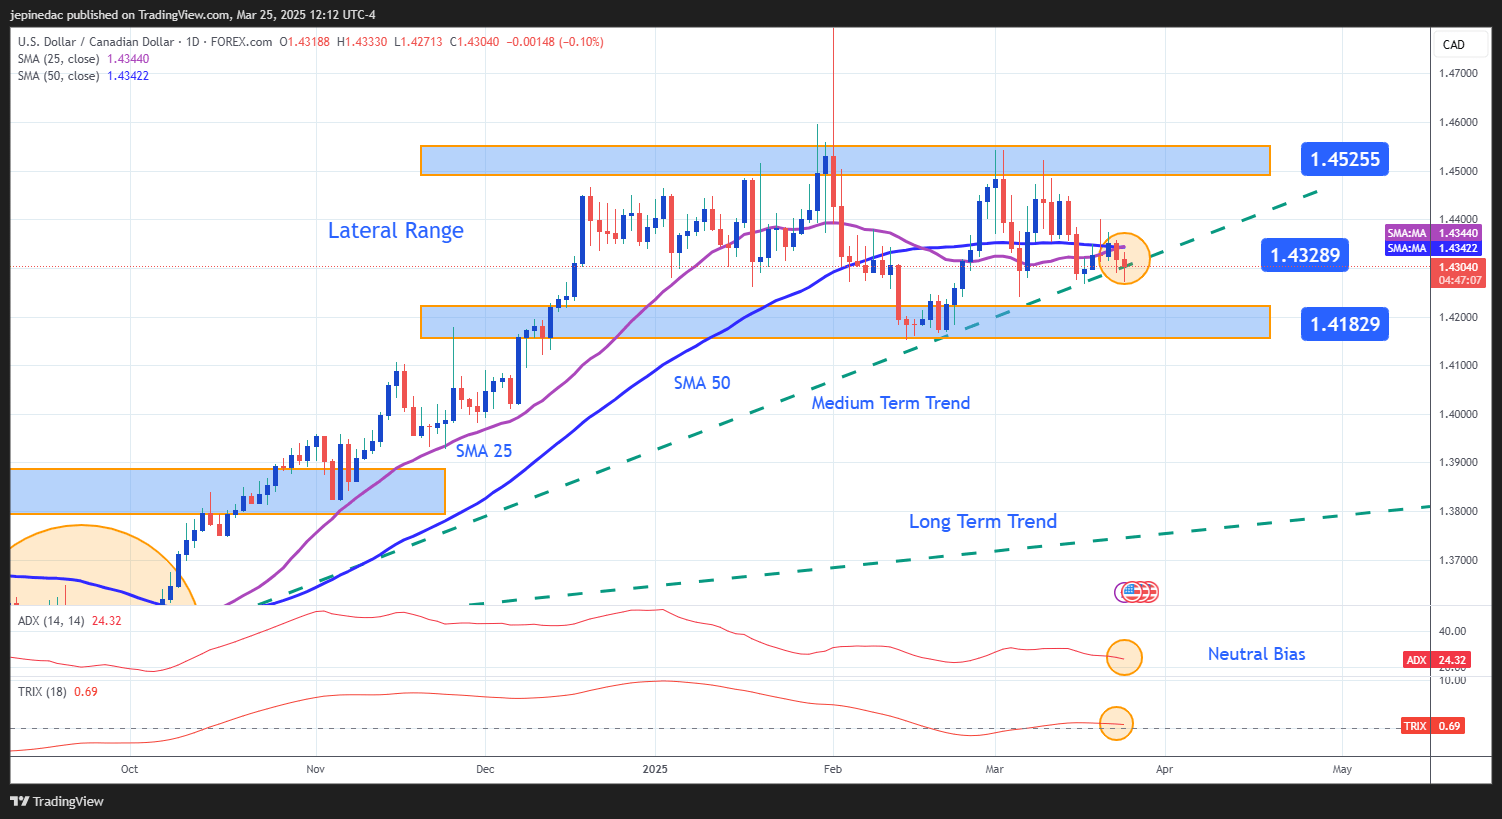
Source: StoneX, Tradingview
- Broad Sideways Range: Since December 2024, USD/CAD has remained within a well-defined sideways range, with resistance at 1.45255 and support at 1.41829. Currently, the price is fluctuating near the middle of the range, and the strength of recent movements has been low making a short-term breakout unlikely. If neutrality continues, this lateral channel may remain the dominant formation in the coming sessions.
- Indicator Neutrality:
- ADX: The ADX line is showing steady oscillations near the 20 level, indicating a lack of clear trend in the last 14 trading sessions.
- TRIX: Similarly, the TRIX line remains near the neutral level at 0, reflecting uncertainty in market direction based on recent moving average data.
Both indicators confirm that price neutrality remains intact, which could be a key factor in maintaining the current sideways channel.
Key Levels:
- ADX: The ADX line is showing steady oscillations near the 20 level, indicating a lack of clear trend in the last 14 trading sessions.
- 1.45255 – Major Resistance: This is the upper boundary of the sideways range. A return to this level could revive a medium-term uptrend, sustaining bullish pressure.
- 1.43289 – Near-Term Barrier: This level aligns with the medium-term trendline and the 25- and 50-period moving averages. If the price remains near this zone, the bullish trend could be at risk, reinforcing the sideways range as the dominant formation.
- 1.41829 – Key Support: This is the lowest level reached in recent months. A break below this zone could trigger significant selling pressure, potentially ending the current bullish structure.
Written by Julian Pineda, CFA – Market Analyst
Latest market news
September 18, 2025 02:48 PM
June 23, 2025 01:22 PM
June 23, 2025 10:39 AM
June 20, 2025 05:23 PM
June 20, 2025 04:46 PM
June 20, 2025 03:35 PM

June 20, 2025 03:35 PM

June 19, 2025 09:09 AM

June 18, 2025 02:55 PM

June 18, 2025 08:19 AM