

The past four trading sessions have been key for USD/CAD movements, with a new short-term bullish bias emerging as the pair has gained over 1.5% in favor of the U.S. dollar. This recent upward move has been supported by the temporary pause in the trade war announced over the weekend, which has contributed to a renewed wave of confidence in the U.S. dollar.

Is Confidence Returning to the U.S. Dollar?
This past weekend was crucial for developments in the U.S.-China trade conflict, with a meeting held between officials from both countries in Geneva. A temporary agreement was reached that includes a 90-day partial suspension of tariffs: the U.S. will reduce tariffs from 145% to 30% on Chinese products, and China will reduce its tariffs from 125% to 10% on U.S. goods. These measures are expected to go into effect before May 14, and both sides agreed to establish a permanent dialogue mechanism aimed at achieving a broader agreement in the coming weeks.
Although temporary, the agreement has helped trigger a quick recovery in market sentiment, as it is perceived as a sign of economic relief after months of tension. In this context, the CNN Fear and Greed Index currently sits at 67 points, within the "greed" zone, a level not seen since October 2024, reflecting improving investor confidence in financial markets.
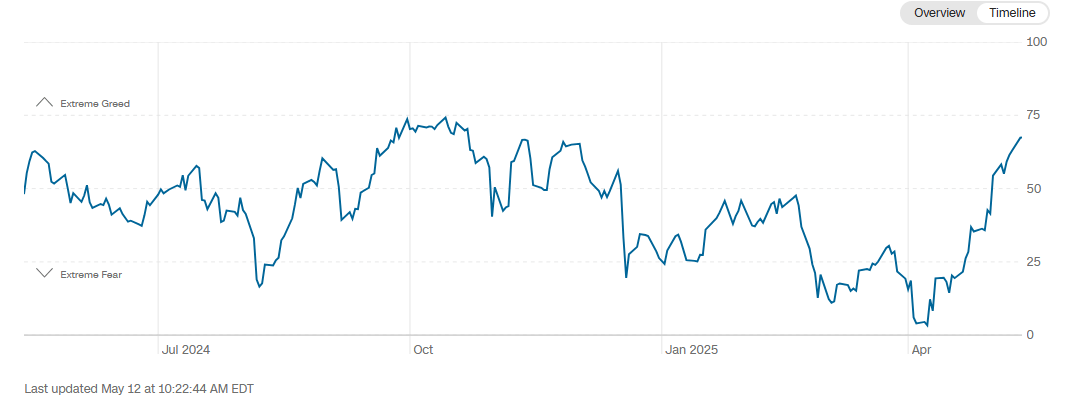
Source: CNN
The easing of trade tensions has not only boosted overall market sentiment, but also benefited the U.S. dollar, which had been one of the hardest-hit currencies since the conflict began. This pause in tariffs has restored investment confidence in the U.S. in the short term. At the same time, the DXY index, which tracks the dollar's strength, has risen above the 100-point mark once again, indicating growing demand for the greenback.
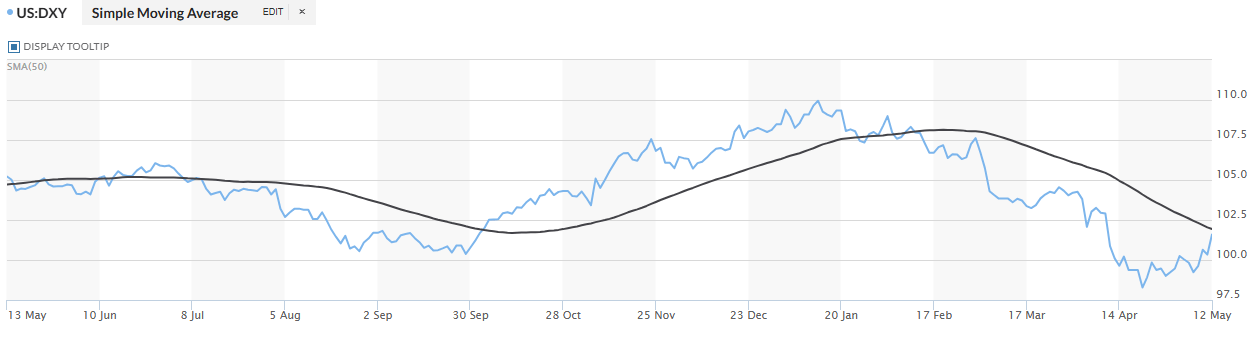
Source: Market Watch
In this scenario, the temporary pause in the trade war has acted as a catalyst for renewed dollar strength, while the Canadian dollar has lagged behind. This has added fresh buying pressure on USD/CAD, which may intensify if confidence in the dollar continues to grow in the coming weeks.
The Role of Central Banks
In terms of monetary policy, the difference in interest rates between the two countries stands out. Currently, the Federal Reserve holds its rate at 4.5%, while the Bank of Canada maintains its rate at 2.75%.
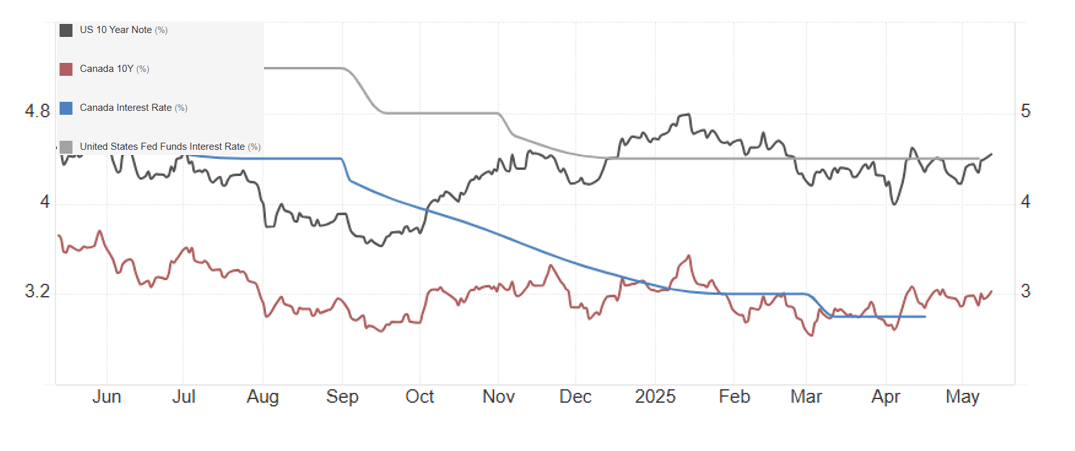
Source: Trading Economics
This disparity has been crucial for the behavior of 10-year government bonds. At present, U.S. Treasury bonds yield 4.43%, compared to 3.2% for Canadian bonds. This difference has persisted due to the Fed's steady policy stance, while the Bank of Canada has started a rate-cutting cycle in recent decisions.
Over the long term, this yield differential could affect the relative strength of both currencies. Although recent USD/CAD movements have been influenced by trade war dynamics, investor preference for higher-yielding and safer assets—such as U.S. bonds—could continue to support demand for dollars, increasing upward pressure on USD/CAD if the current outlook for both central banks remains unchanged.
USD/CAD Technical Outlook
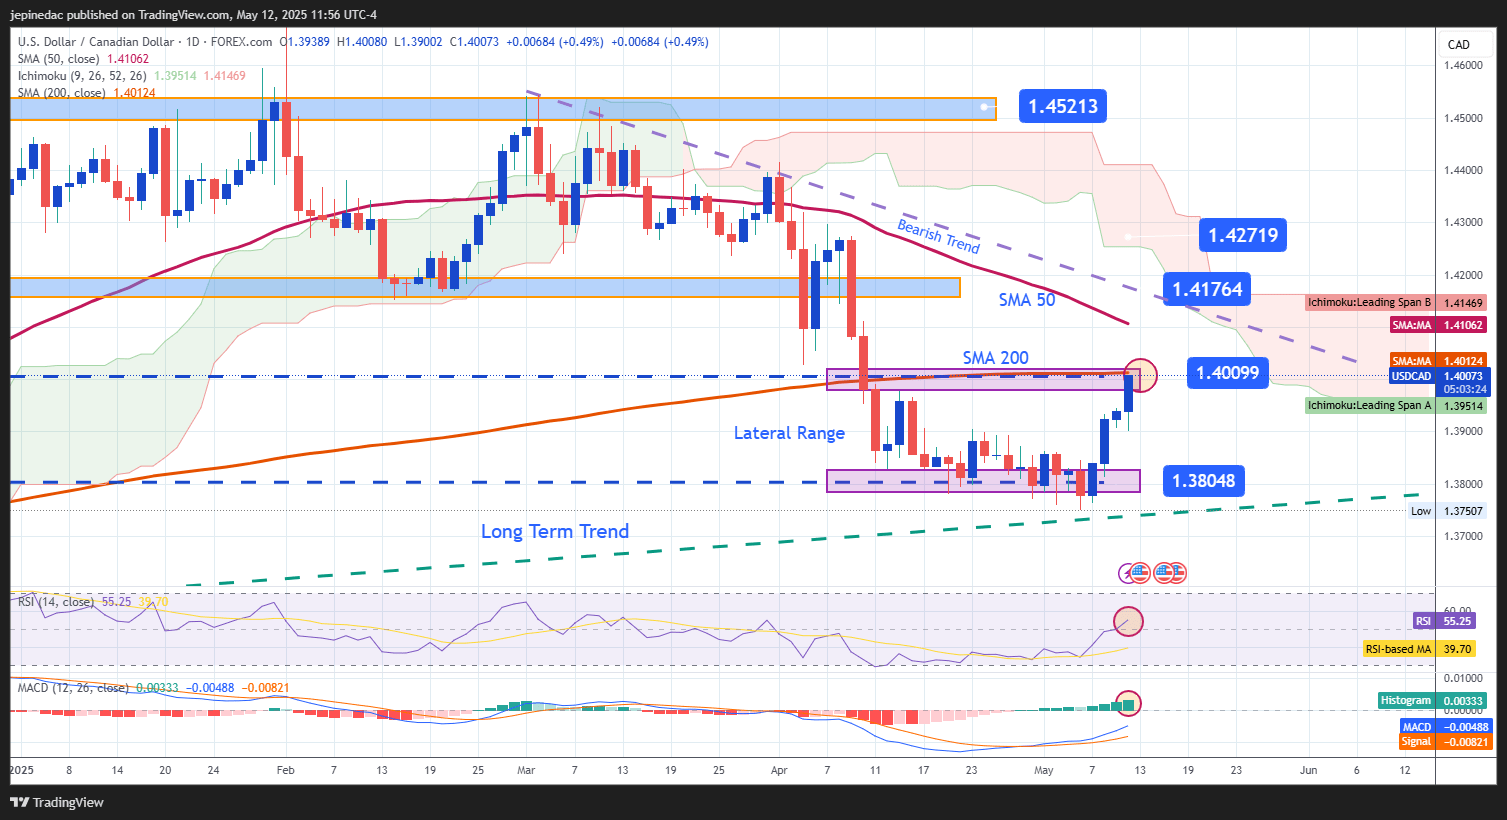
Source: StoneX, Tradingview
- New Lateral Range: Since mid-April, a new short-term lateral range has started to form, marked by resistance at 1.40099 and support at 1.38048. Recent bullish price action has brought the pair to the upper boundary of this channel, but no significant breakout has occurred, so this neutral range remains the most important technical structure to monitor in the short term.
- RSI: The RSI line has crossed above the neutral 50 level, highlighting the buying momentum currently reflected in recent USD/CAD price movements. However, if RSI fails to continue rising above 50, this could signal a neutral sentiment in the short term.
- MACD: The MACD histogram remains in positive territory, suggesting that the moving average momentum is still bullish. As long as the histogram does not show signs of weakening, this would support ongoing buying pressure.
Key Levels:
- 1.40099 – Major Resistance: This level matches the upper boundary of the current lateral range and the 200-period moving average. A breakout above this level would confirm strong buying momentum and pave the way for a more significant bullish move.
- 1.41764 – Key Resistance: A more distant level, aligned with the 50-period moving average and the downtrend line in place since early March. A breakout here could end the multi-month bearish bias and signal a broader trend reversal.
- 1.38048 – Key Support: Marks the lower boundary of the current range. A break below this level would revive selling pressure and continue the longer-term bearish trend that has prevailed in recent months.
Written by Julian Pineda, CFA – Market Analyst
Follow him at: @julianpineda25
Latest market news
September 18, 2025 02:48 PM
June 23, 2025 01:22 PM
June 23, 2025 10:39 AM
June 20, 2025 05:23 PM
June 20, 2025 04:46 PM
June 20, 2025 03:35 PM

June 20, 2025 05:23 PM

June 20, 2025 12:21 PM

June 20, 2025 05:20 AM

June 20, 2025 12:39 AM