

US Dollar Outlook: USD/CHF
USD/CHF clears the January low (0.8966) as it tumbles to a fresh yearly low (0.8913), with the weakness in the exchange rate pushing the Relative Strength Index (RSI) to its lowest level since September.
USD/CHF Stages Four-Day Selloff for First Time Since September
USD/CHF is on track to mark a four-day selloff for the first time since September after struggling to trade back above the 50-Day SMA (0.9054), and the exchange rate may depreciate over the remainder of the month as it no longer responds to the positive slope in the moving average.
Join David Song for the Weekly Fundamental Market Outlook webinar.
David provides a market overview and takes questions in real-time. Register Here
In turn, USD/CHF may continue to give back the advance from the December low (0.8736) as it carves a series of lower highs and lows, and a move below 30 in the RSI is likely to be accompanied by a further decline in the exchange rate like the price action from last year.
With that said, the selloff in USD/CHF may persist as it carves a bearish price series, but the RSI may show the bearish momentum abating should it struggles to push into oversold territory.
USD/CHF Price Chart – Daily
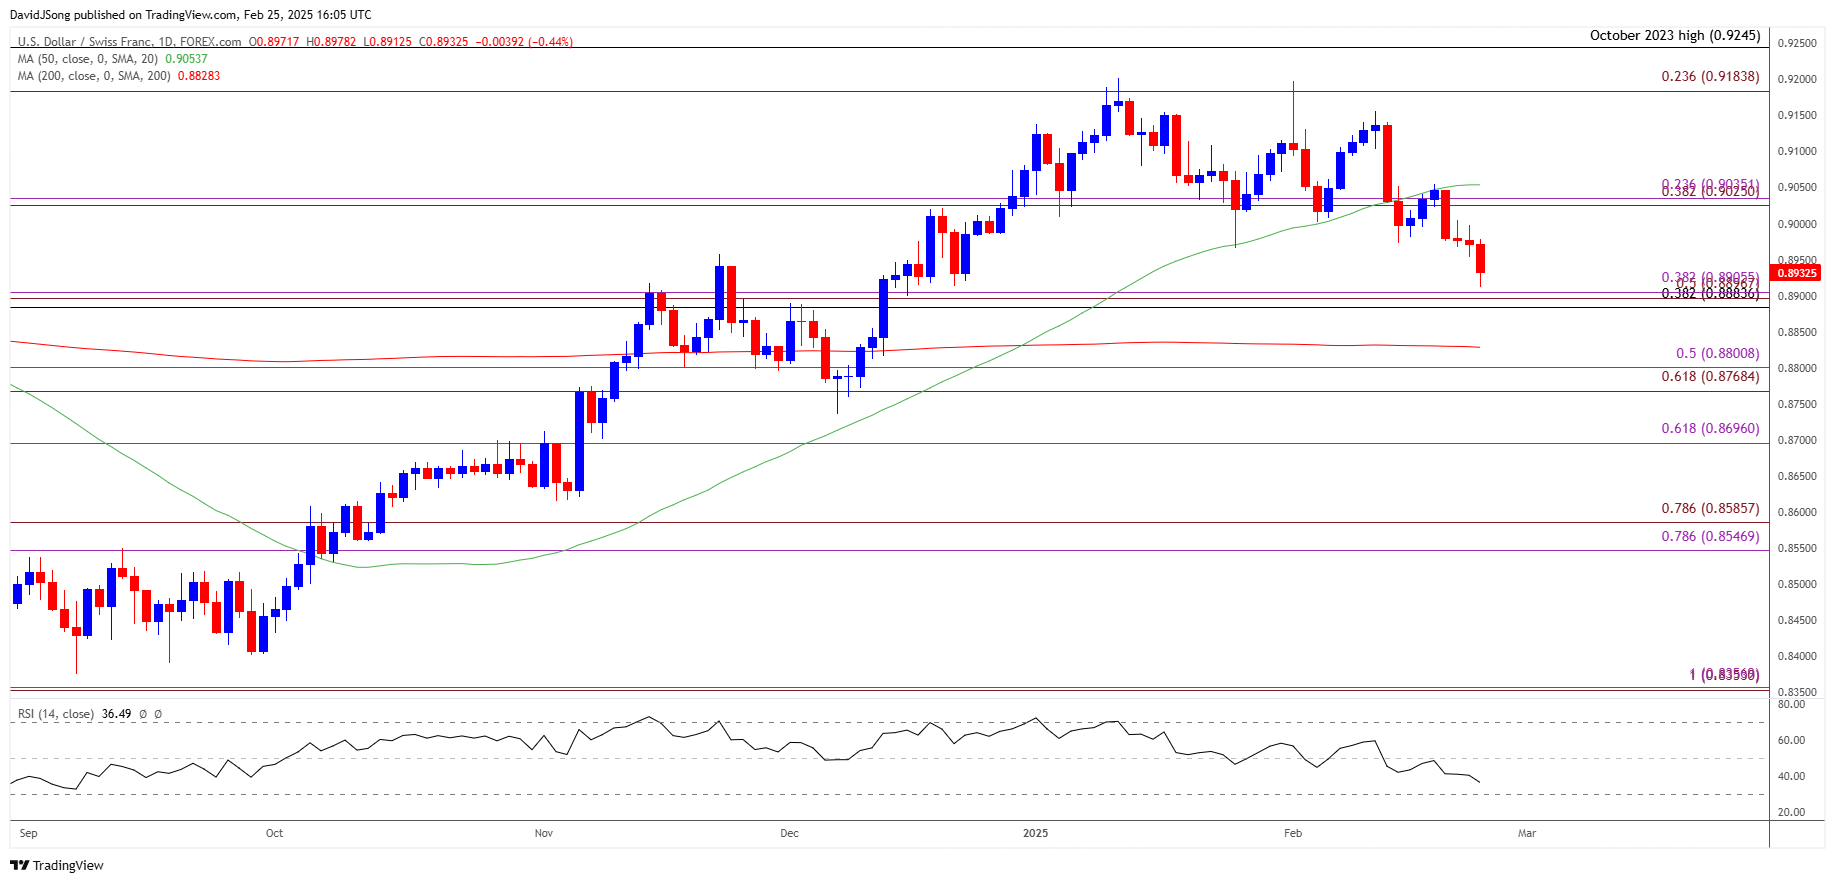
Chart Prepared by David Song, Senior Strategist; USD/CHF Price on TradingView
- USD/CHF extends the recent series of lower highs and lows to register a fresh yearly low (0.8913), with a break/close below the 0.8880 (38.2% Fibonacci retracement) to 0.8910 (38.2% Fibonacci extension) zone raising the scope for a move towards the 0.8770 (61.8% Fibonacci extension) to 0.8800 (50% Fibonacci extension) region.
- Next area of interest comes in around the December low (0.8736), but lack of momentum to break/close below the 0.8880 (38.2% Fibonacci retracement) to 0.8910 (38.2% Fibonacci extension) zone may curb the bearish price series.
- Need a move back above the 0.9030 (38.2% Fibonacci extension) to 0.9040 (23.6% Fibonacci extension) region to bring the monthly high (0.9197) back on the radar, with a close above 0.9180 (23.6% Fibonacci extension) to opening up the October 2023 high (0.9245).
Additional Market Outlooks
Australian Dollar Forecast: AUD/USD Falls from Channel Resistance
USD/JPY Halts Three-Day Selloff to Keep RSI Above Oversold Zone
US Dollar Forecast: GBP/USD Approaches Channel Resistance
Canadian Dollar Forecast: USD/CAD Coils Ahead of Trump Tariffs
--- Written by David Song, Senior Strategist
Follow on Twitter at @DavidJSong

Latest market news
September 18, 2025 02:48 PM
June 23, 2025 01:22 PM
June 23, 2025 10:39 AM
June 20, 2025 05:23 PM
June 20, 2025 04:46 PM
June 20, 2025 03:35 PM

June 20, 2025 02:18 PM

June 19, 2025 10:00 AM

June 18, 2025 04:35 PM

June 18, 2025 08:43 AM