

USD/JPY Talking Points:
- It’s been a sizable reaction of Yen-weakness after the Bank of Japan meeting yesterday and that’s led to a breakout above the 145.00 level in USD/JPY, and a massive extension in the rally in GBP/JPY following the 190.00 support test.
- For tomorrow the USD and EUR/USD are in the spotlight with Non-farm Payrolls and Eurozone CPI.
- I look in to each of these pairs in every weekly webinar and you’re welcome to join live. Click here for registration information.

Yen-weakness has continued and so far, USD/JPY hasn’t stopped or shown resistance at the 145.00 level. There’s still a lot of tape until the end of the week, however, and if bears do respond, that could keep the door open for USD-weakness. But whether that happens will likely have something to do with tomorrow’s economic calendar as there’s a Non-farm Payrolls report set to be released on Friday morning just a few hours after the Eurozone CPI report which could also have some pull on the U.S. Dollar.
In USD/JPY, the pair is now pushing to the underside of a trendline and this sets up a fresh higher-high which could add definition to the earlier-week swing low. The 140.00 level has once again come in to set a major spot of support for the pair as that price was the low last year and so far again this year.
Prior resistance at 144.00 is now set up as higher-low support potential and the question as to whether or not sellers react to the current test above the 145.00 handle is a big item for the pair as we move into the end of the week.
USD/JPY Daily Price Chart
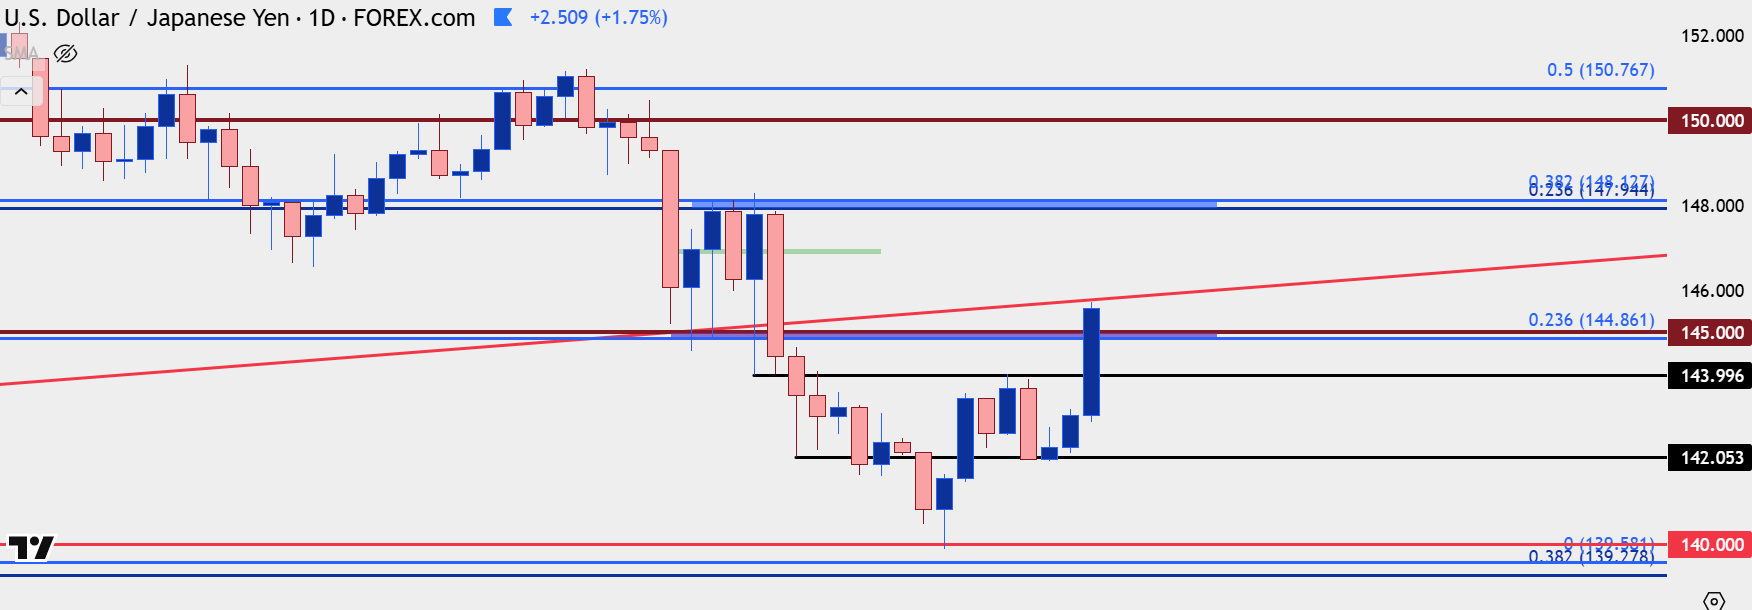 Chart prepared by James Stanley; data derived from Tradingview
USD
As looked at yesterday the U.S. Dollar’s first four months of the year were probably surprising given how the currency came into 2025 trade. A strong bullish reversal in Q4 of last year was entirely erased and price continues to trade right around those prior lows from Q3 of last year. As a matter of fact, current resistance is right at the 2024 low of 100.22 in DXY.
USD Weekly Chart
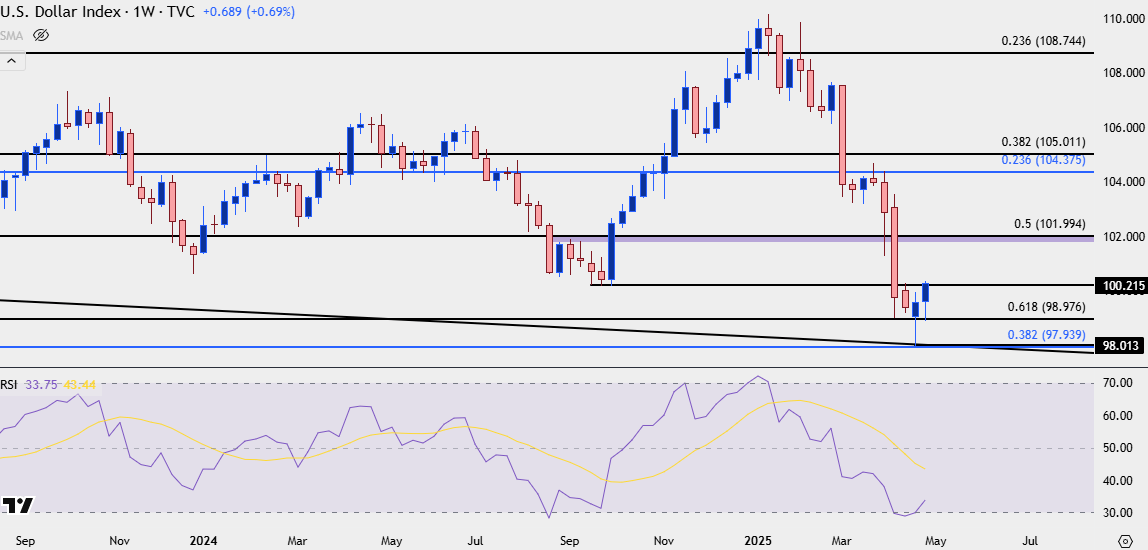 Chart prepared by James Stanley; data derived from Tradingview
But, there was some building context for a pullback and that pullback can possibly continue into more of a reversal; but, again, this will likely need some help from NFP and possibly even EUR/USD to come to fruition.
In DXY, the currency has bounced from oversold conditions on the weekly chart and that had popped up a couple of weeks ago. The monthly chart showed a massive spot of support and, so far, that’s the lower-low with this week’s rally showing as a higher-low from the 98.98 Fibonacci level. And on an even shorter-term basis, the inverse head and shoulders pattern that I had looked at yesterday has now given way, and the door remains open for bulls to make a continued push.
U.S. Dollar Four-Hour Price Chart
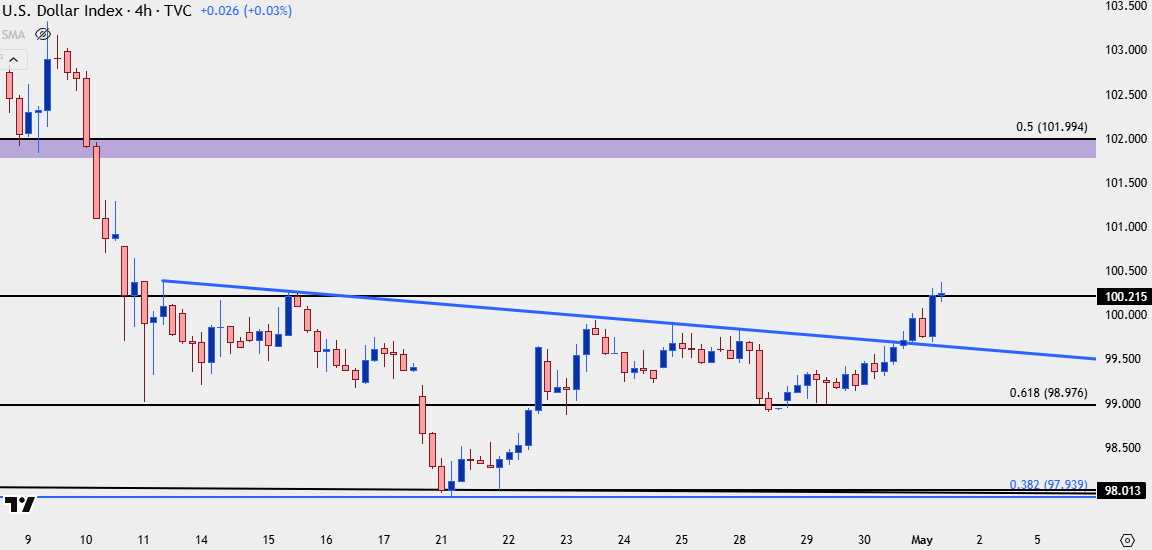 Chart prepared by James Stanley; data derived from Tradingview
EUR/USD
EUR/USD printed a shooting star formation last week and that goes along with an overbought RSI reading, both items that point to possible downside. In early-May trade, sellers are taking a push and going down for a test of the 1.1275 level, which is a key Fibonacci level that held support a couple weeks ago following the pair’s initial flare past 1.1400.
And in the mirror image of the USD setup looked at above, there was a shorter-term head and shoulders pattern yesterday that I had looked at in the video as well as the Tuesday webinar. That neckline is in blue on the below chart. But, perhaps more compelling from the below daily, there’s now another head and shoulders formation that’s appeared and that’s with a flat neckline at the 1.1275 level.
For now, given the strength in the pair for the past two months, it would probably be best to look at this as more of a pullback than a reversal, although a reversal can certainly develop. The next support level down is the 1.1200 handle, with prior resistance at the 1.1100 and 1.1000 psychological levels below that.
EUR/USD Daily Price Chart
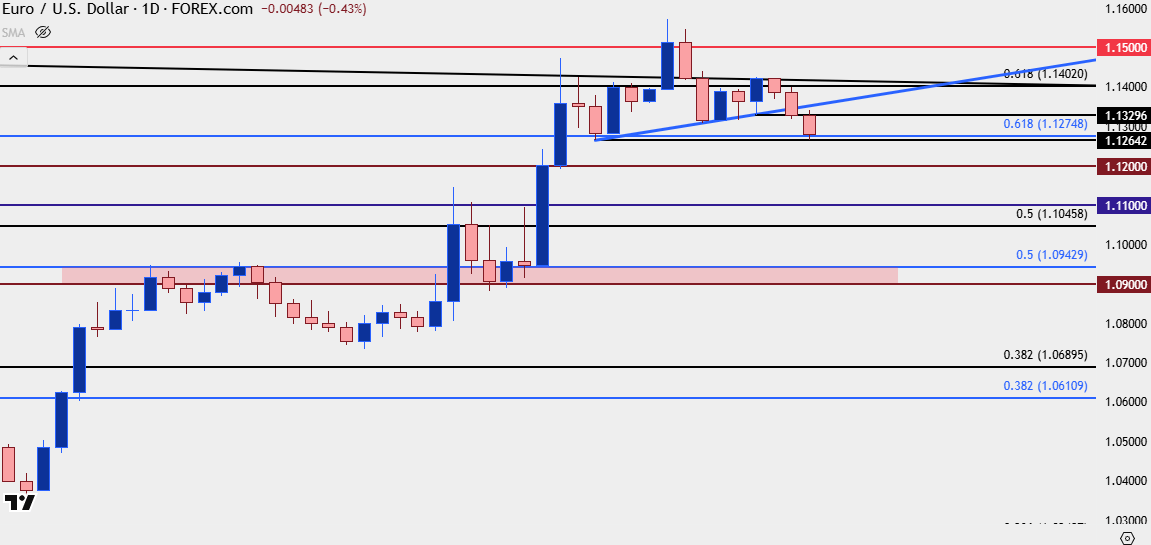
Chart prepared by James Stanley; data derived from Tradingview
--- written by James Stanley, Senior Strategist
Latest market news
September 18, 2025 02:48 PM
June 23, 2025 01:22 PM
June 23, 2025 10:39 AM
June 20, 2025 05:23 PM
June 20, 2025 04:46 PM
June 20, 2025 03:35 PM

June 20, 2025 05:23 PM

June 20, 2025 12:21 PM

June 20, 2025 05:20 AM

June 20, 2025 12:39 AM