

Key Events
- The upcoming FOMC outlook is driving market uncertainty this week amid trade negotiations, following a series of concerning U.S. economic releases
- The U.S. Dollar remains range-bound, gold has reclaimed ground above $3,350, and USDJPY has pulled back to 142
With the FOMC at the center of this week’s volatility risk, market caution has taken hold following last week’s weak data: contracting manufacturing activity, advance GDP at -0.3%, and Core PCE at 0%. Markets are now consolidating:
- U.S. indices remain below key resistance levels (Nasdaq below 20230, Dow below 41500, and spx500 below 5700)
- Gold has climbed back above $3,350 on safe haven flows
- The DXY (Dollar Index) is holding within a narrow range above the 98 support
- USDJPY has dipped back toward 142, highlighting haven preference over risk ahead of Wednesday’s decision
Additional insights are expected on Friday from BOE Governor Bailey following Thursday’s monetary policy decision, as well as from Federal Reserve members after the rate announcement, Chair Powell’s outlook, and the mid-week market reaction.
Quantifying Uncertainty with Technical Analysis
USDJPY Forecast: 3-Day Time Frame – Log Scale
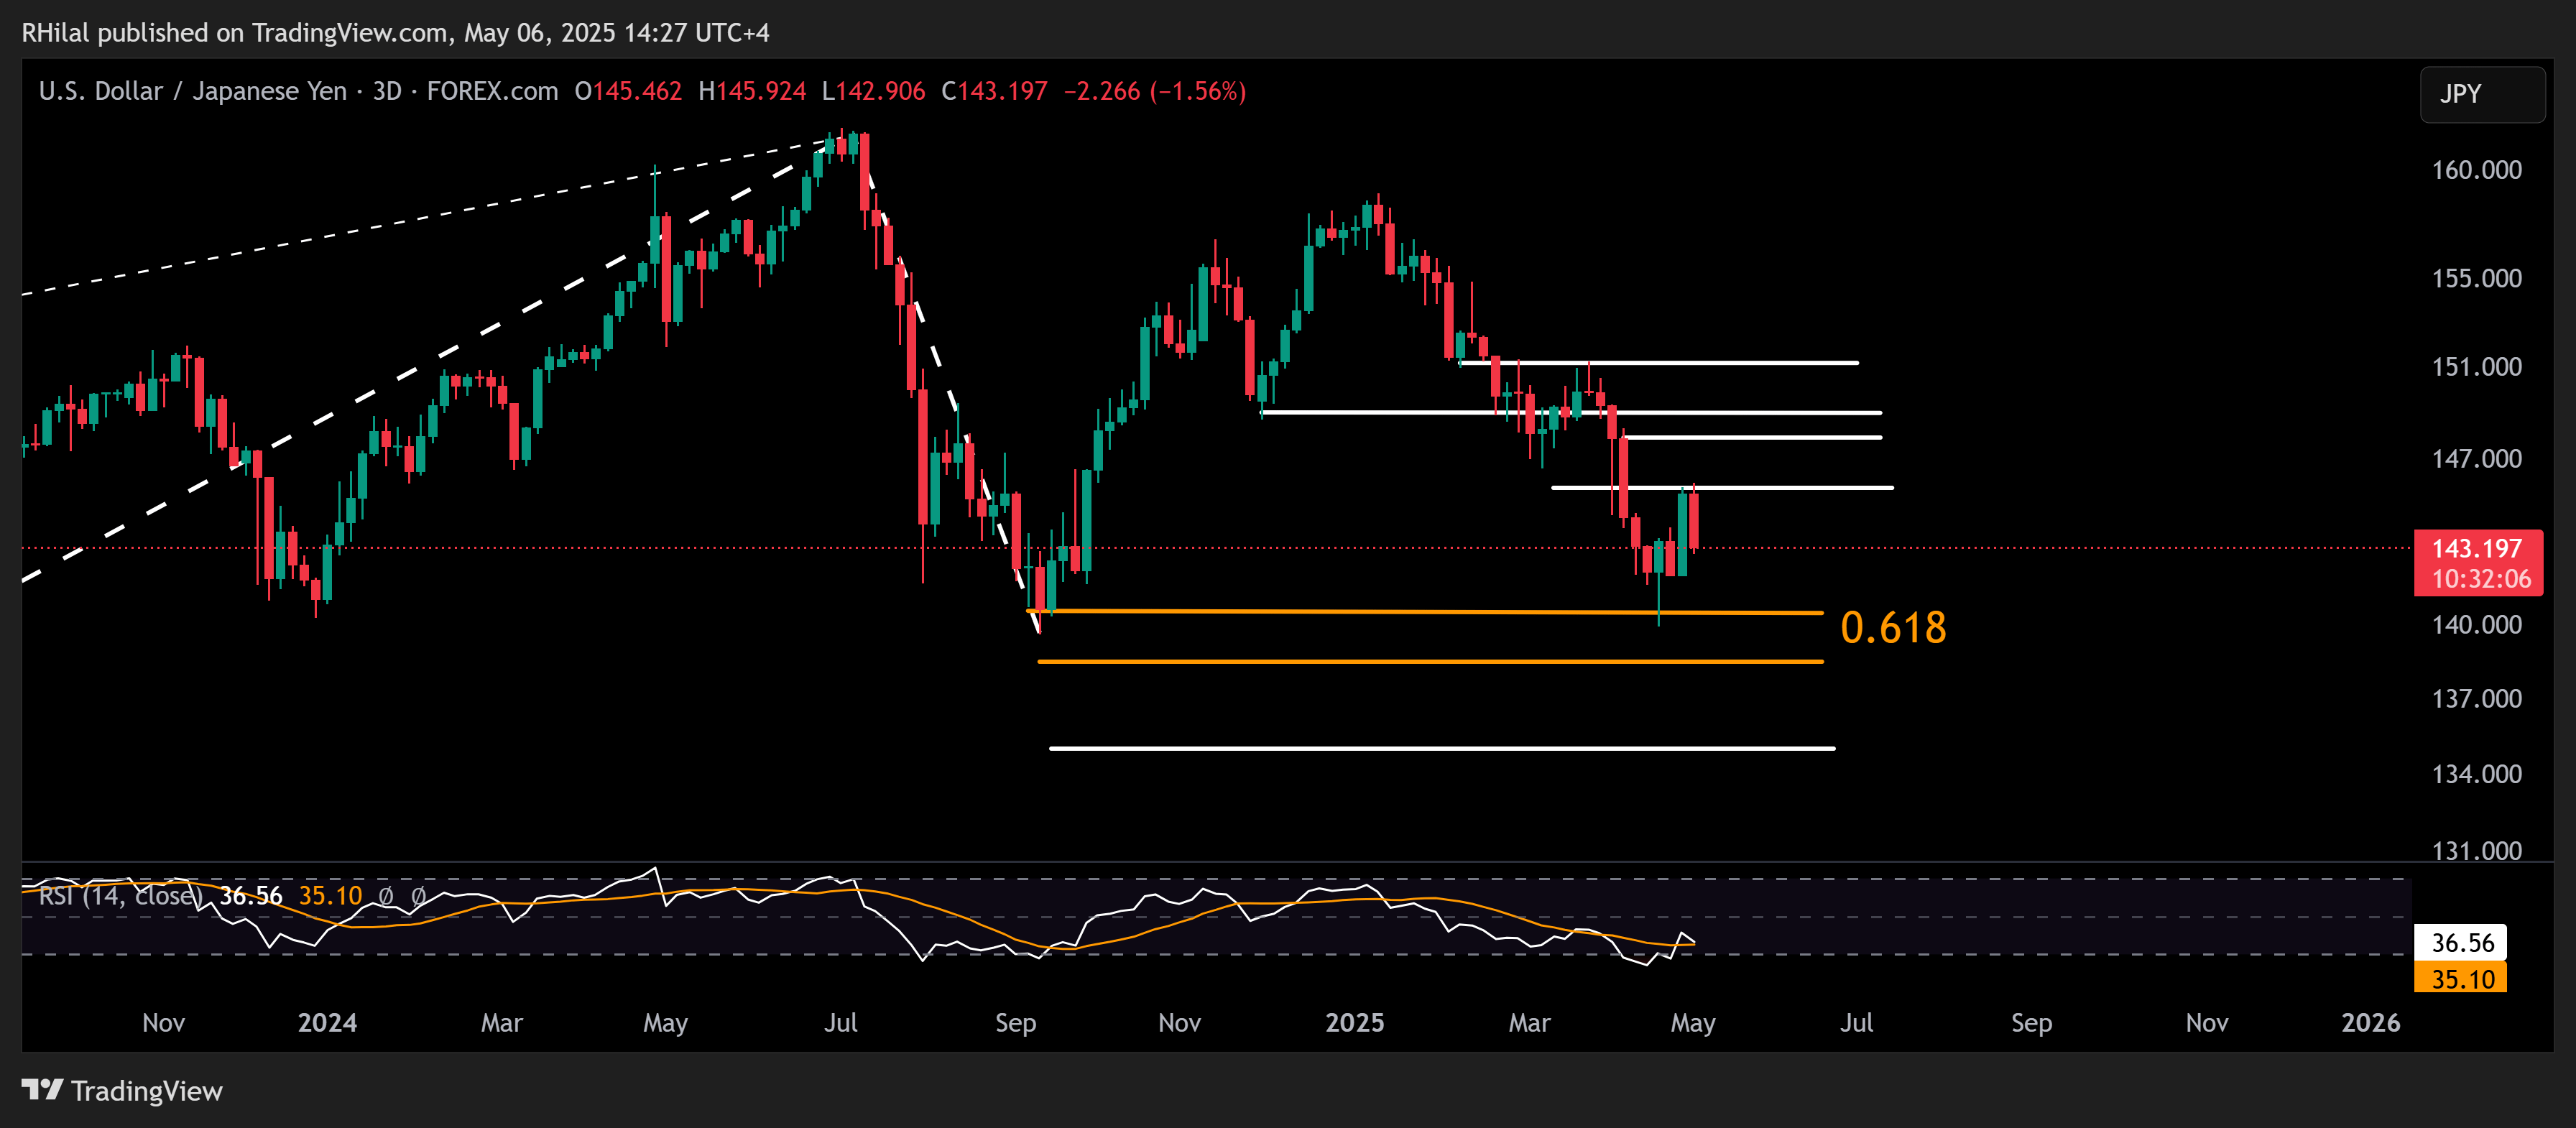
Source: Trading view
USDJPY remains above the 0.618 Fibonacci retracement zone at 139, stemming from the uptrend between January 2023 (127.20) and July 2024 (162.00). However, the pair is currently trading below resistance at 146, steering the trend back toward key support levels at 142 and 139.
A decisive break below 139 could expose new 2025 lows near 138.30 and 134.60, both key Fibonacci levels. On the upside, a rebound above 146 may open the way to 149 and 151, testing the grounds for a more sustainable uptrend.

Gold Forecast: 4H Time Frame – Log Scale
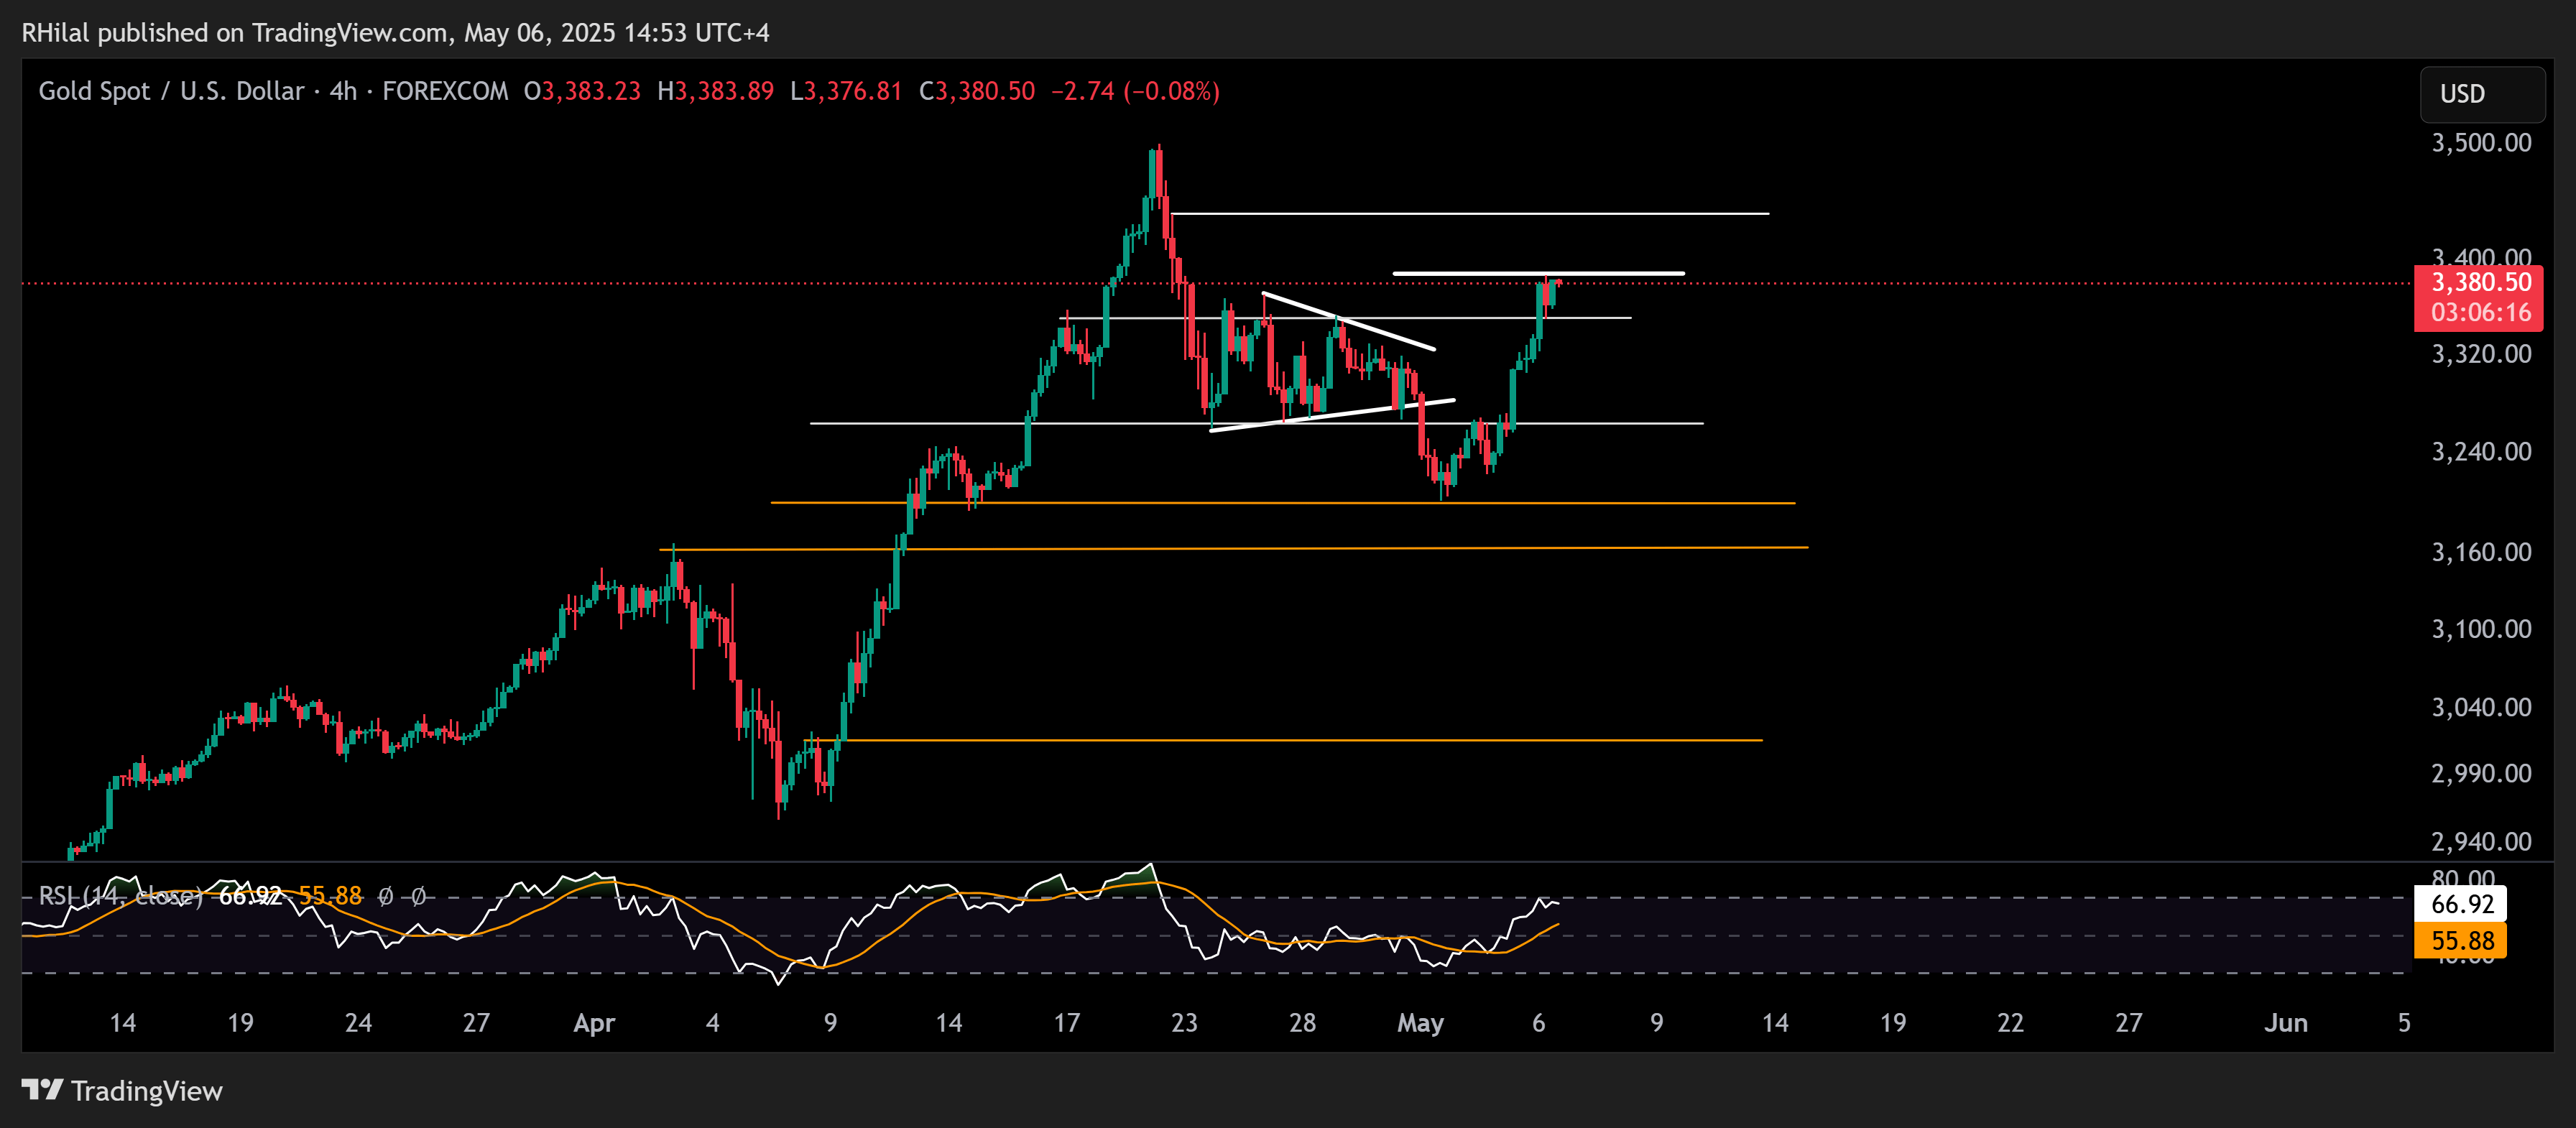
Source: Trading view
Gold is currently testing the 0.618 Fibonacci retracement of the drop from $3,500 to $3,200, located at the $3,380 level. A clear hold above that level could pave the way back toward $3,430 and the $3,500 resistance zone.
- A breakout above $3,500 may extend the rally toward $3,700 and the $4,000 target zone.
- On the downside, short-term support levels may be seen at $3,350, $3,300, and $3,260.
- A confirmed drop below $3,260 could trigger deeper downside risks, with potential moves back toward $3,200, $3,160, $3,080, and $3,000.

Written by Razan Hilal, CMT
Follow on X: Rh_waves
Latest market news
Today 09:03 AM
Today 08:53 AM
Today 06:15 AM

May 4, 2025 09:49 AM

April 28, 2025 04:11 PM

April 28, 2025 08:14 AM
April 28, 2025 03:25 AM