

Key Events
- U.S.–China tariff talks took a positive turn over the weekend in Geneva, keeping risk assets near key resistance levels
- U.S. indices are trading at "liberation day" zones, eyeing a breakout if trade resolutions are confirmed
- U.S. CPI later this week could introduce sharp volatility, especially if trade optimism fades
Trade Talks: Progress, But No Deal Yet
Despite signals of progress in U.S.–China negotiations, no formal agreement has emerged. Both economies are operating at restrained levels reminiscent of 2020, and discussions remain centered on sticking points — including U.S. tariffs on Chinese goods and China's export controls on rare earth minerals.
Markets are largely positioned for upside across oil, equities, and the U.S. dollar, betting on a resolution. However, the final steps could prove challenging, with investors wary of any breakdown in talks. As China’s trade representative Li Chenggang noted by Bloomberg, “As we say back in China, if the dishes are delicious, the timing doesn’t matter. Whenever it gets released, it will be good news for the world.”
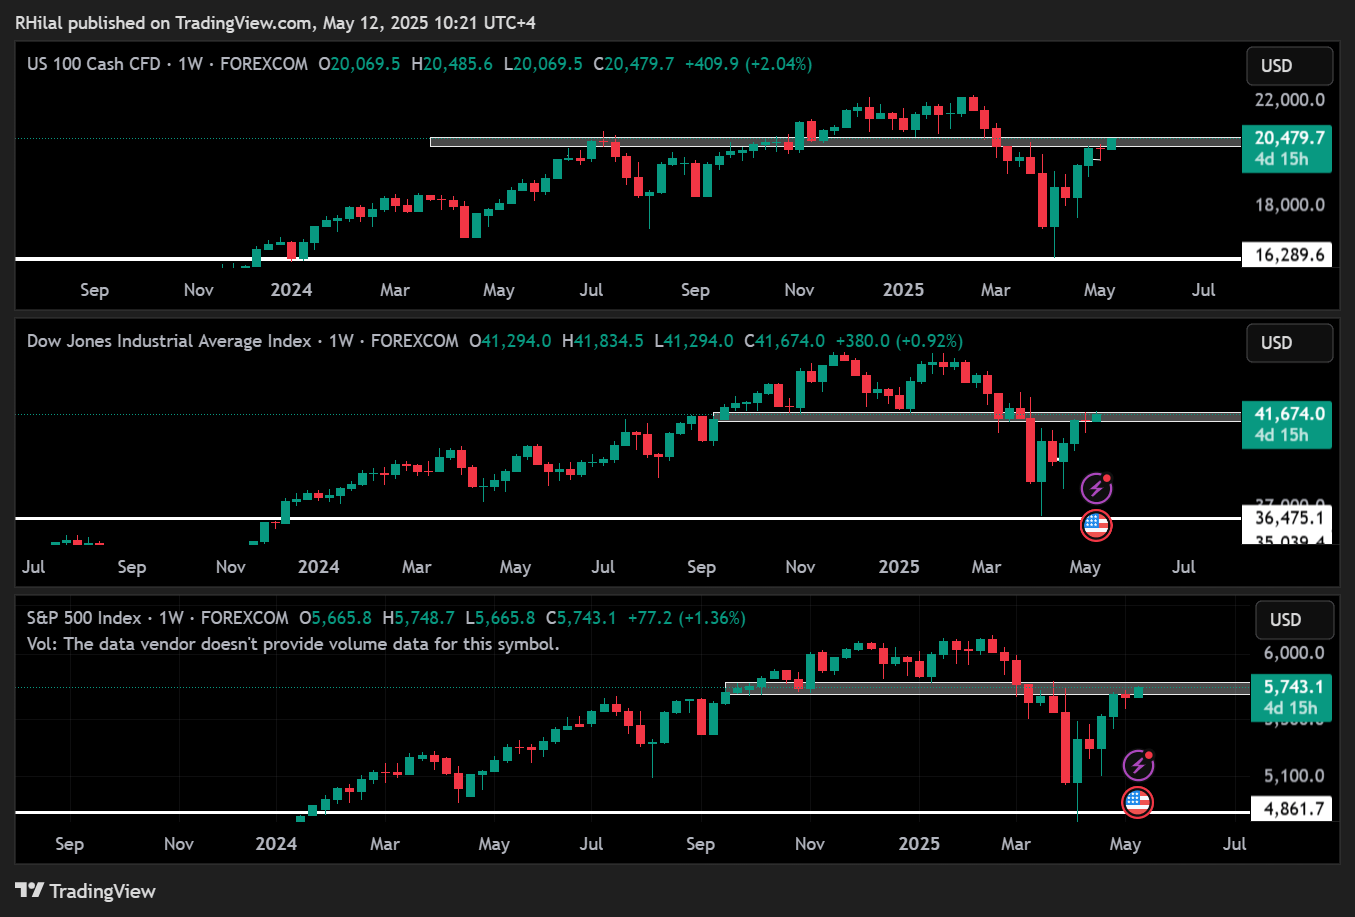
That optimism is echoed in the charts, where U.S. indices are hovering near major resistance — including the neckline of double top formations seen from December 2024 to February 2025.
Nasdaq, Dow, SPX500 – Weekly Time Frame – Log Scale
Source: Tradingview

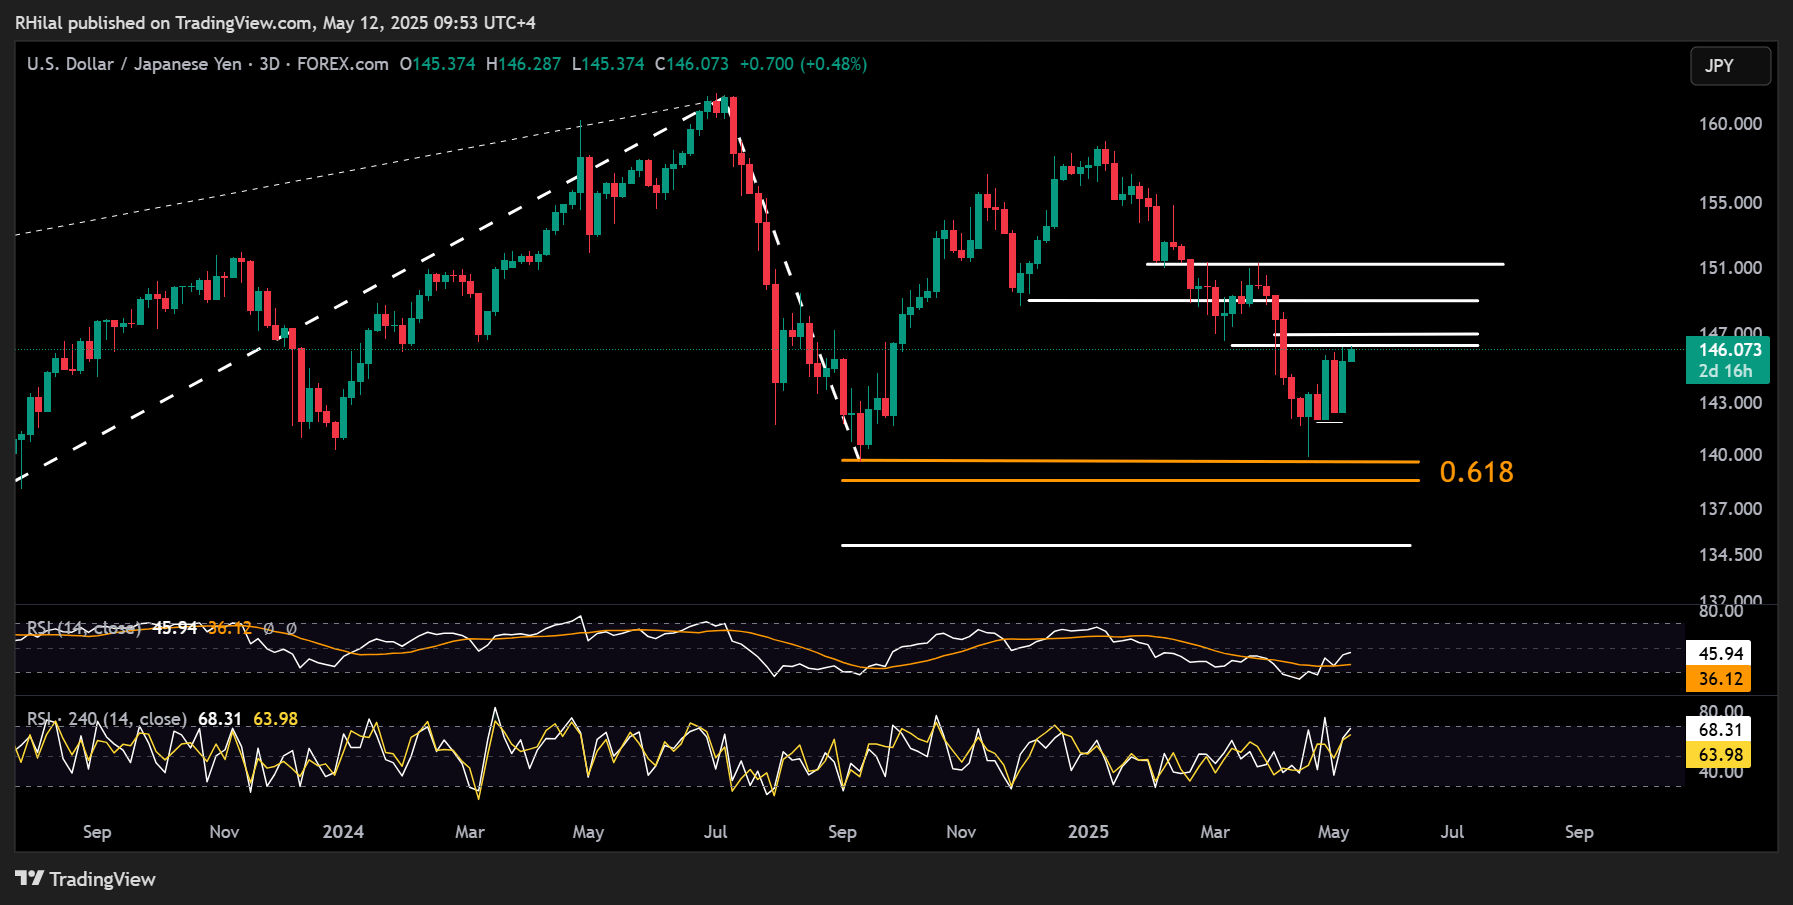
USDJPY Outlook: 3-Day Time Frame – Log Scale
Source: Tradingview
The USDJPY is holding a modest rebound just below the March 2025 low at 146.30, supported by dollar stability and trade optimism. This level is technically significant — it coincides with the 0.272 Fibonacci retracement of the January–April 2025 downtrend and momentum indicators showing neutral-to-overbought conditions on the 3day and 4 hour charts.
Upside Scenario: A clean break above 146.30 may extend gains toward 146.90, 149.00, and 151.30.
Downside Scenario: Failure to hold 146.30 could lead to a pullback to 144.00, 142.00, and 139.00, deepening the bearish case into the second half of 2025.

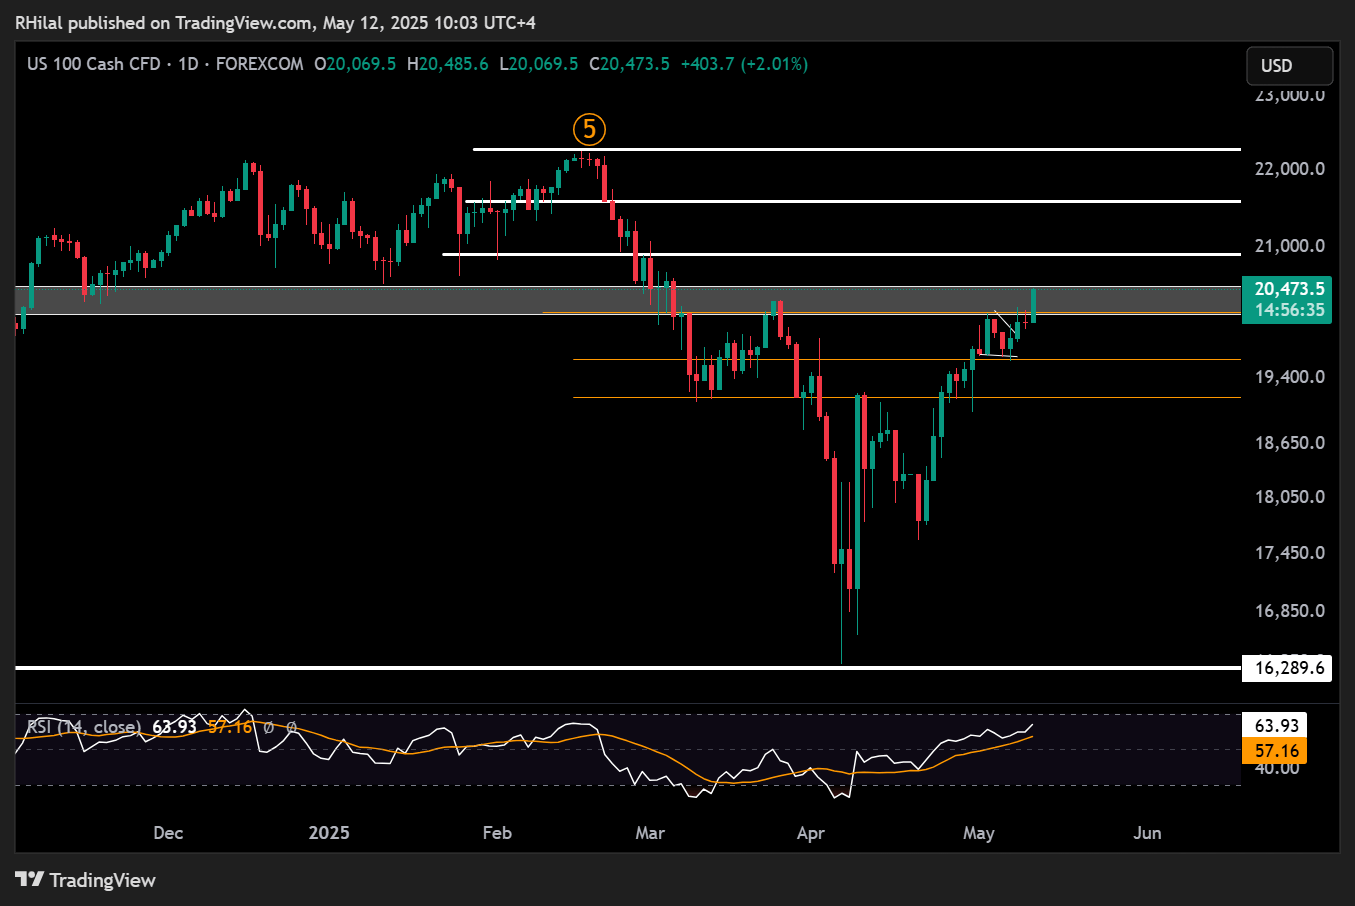
Nasdaq Outlook: Weekly Time Frame – Log Scale
Source: Tradingview
As shown in the indices chart above, price action is hovering near the neckline of a well-defined double top pattern, formed between December 2024 and February 2025 across the Dow, SPX500, and Nasdaq. This reinforces a key resistance zone that could either validate a more sustainable bullish outlook into 2025 — or trigger another correction if rejected.
Nasdaq Upside Scenario: A confirmed hold above 20,530 may extend gains toward 20,900, 21,500, and 22,200.
Downside Scenario: A pullback below 20,500 could find support at 20,200, 19,600, and 19,170, respectively.
Written by Razan Hilal, CMT
Follow on X: @Rh_waves
Latest market news
September 18, 2025 02:48 PM
June 23, 2025 01:22 PM
June 23, 2025 10:39 AM
June 20, 2025 05:23 PM
June 20, 2025 04:46 PM
June 20, 2025 03:35 PM

June 19, 2025 11:09 PM

June 18, 2025 09:32 PM
June 17, 2025 10:59 PM
June 16, 2025 10:27 PM