

US Dollar Outlook: USD/JPY
USD/JPY pulls back ahead of the 50-Day SMA (146.78) to snap the recent series of higher highs and lows, but the Federal Reserve interest rate decision may prop up the US Dollar as the central bank is expected to retain the current policy.
USD/JPY Rebound Unravels with Fed Rate Decision on Tap
USD/JPY approaches the monthly low (142.88) after showing a kneejerk reaction to the US Non-Farm Payrolls (NFP) report, and the exchange rate may continue to give back the advance from the start of May as it appears to be tracking the negative slope in the moving average.
Join David Song for the Weekly Fundamental Market Outlook webinar.
David provides a market overview and takes questions in real-time. Register Here
In turn, USD/JPY may struggle to retain the rebound from the yearly low (139.89) as the ongoing shift in US trade policy raises the threat of a recession, and the exchange rate may may stage further attempts to test the 2024 low (139.58) as President Donald Trump argues that ‘the Fed should lower its rate.’
US Economic Calendar

Nevertheless, the 177K rise in US NFP may keep the Federal Open Market Committee (FOMC) on the sidelines as Chairman Jerome Powell insists that ‘we do not need to be in a hurry to adjust our policy stance,’ and more of the same from the Fed may generate a bullish reaction in the US Dollar as the central bank continues to combat inflation.
However, the FOMC may stay on track to further unwind its restrictive policy as the ‘median participant projects that the appropriate level of the federal funds rate will be 3.9 percent at the end of this year,’ and swings in the carry trade may sway USD/JPY as the Fed keeps the door open to implement lower interest rates.
With that said, USD/JPY may struggle to retain the advance from the start of the month as it pulls back ahead of the 50-Day SMA (146.78), but the exchange rate may threaten the negative slope in the moving average should it further retrace the decline from the April high (150.49).
USD/JPY Price Chart – Daily
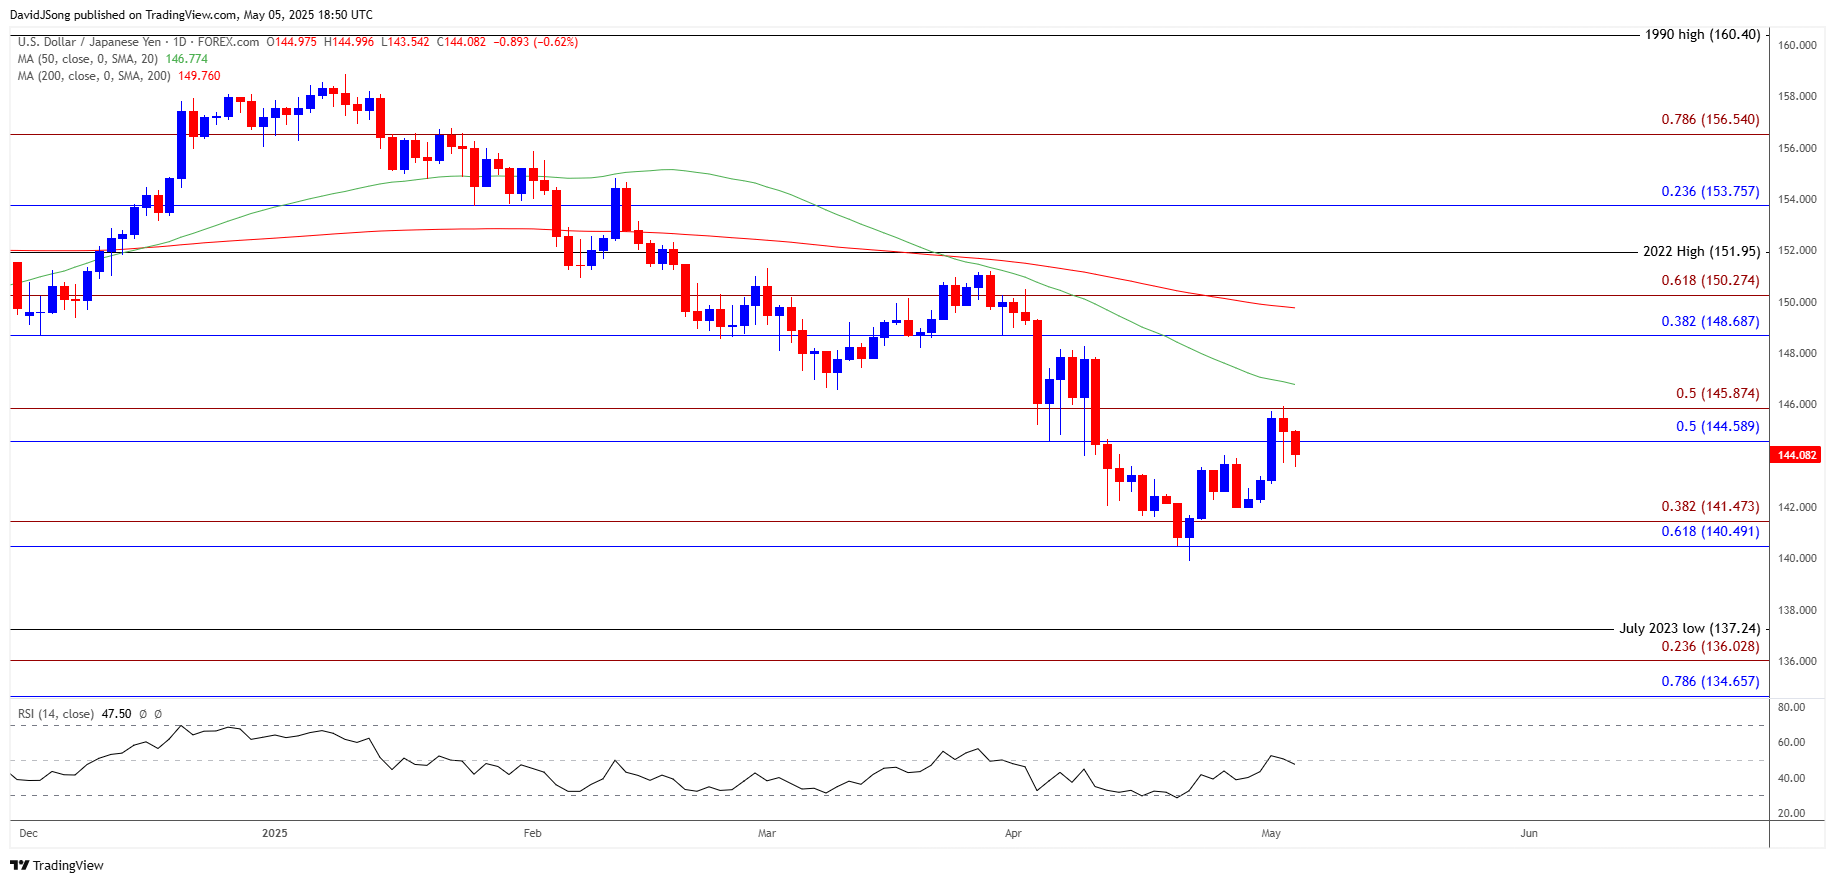
Chart Prepared by David Song, Senior Strategist; USD/JPY on TradingView
- USD/JPY snaps the recent series of higher highs and lows following the failed attempt to push/close above the 144.60 (50% Fibonacci retracement) to 145.90 (50% Fibonacci extension) region, and lack of momentum to hold above the monthly low (142.88) may push the exchange rate towards the yearly low (139.89).
- A close below the 140.50 (61.8% Fibonacci retracement) to 141.50 (38.2% Fibonacci extension) zone opens up the July 2023 low (137.24), but the exchange rate may continue to hold above the 2024 low (139.58) should it defend the advance from the monthly low (142.88).
- Need a close above the 144.60 (50% Fibonacci retracement) to 145.90 (50% Fibonacci extension) region to bring the around 148.70 (38.2% Fibonacci retracement) to 150.30 (61.8% Fibonacci extension) zone on the radar, with then next area of interest coming in around the April high (150.49).
Additional Market Outlooks
British Pound Forecast: GBP/USD Selloff Stalls Ahead of BoE Meeting
Gold Price Falls Toward 50-Day SMA
Canadian Dollar Forecast: USD/CAD Vulnerable to Fresh Yearly Lows
Australian Dollar Forecast: AUD/USD Pulls Back Ahead of December High
--- Written by David Song, Senior Strategist
Follow on Twitter at @DavidJSong

Latest market news
September 18, 2025 02:48 PM
June 23, 2025 01:22 PM
June 23, 2025 10:39 AM
June 20, 2025 05:23 PM
June 20, 2025 04:46 PM
June 20, 2025 03:35 PM

May 14, 2024 01:20 AM
August 18, 2023 01:36 AM

August 17, 2023 11:05 PM

October 26, 2022 01:00 PM