

View related analysis:
- Crude Oil Forecast: Short Covering and WTI Spread Hint at Bounce
- S&P/ASX 200, Hang Seng Analysis: Price Action Setups
- USD/JPY, USD/CHF Rise for 2nd Day, Market Forces Lend SNB a Hand
- Tentative Signs of a US Dollar Rebound Ahead of Powell speech
WTI Crude Oil Futures (CL) market Positioning – COT Report
There are a few competing forces visible in the CME positioning data, which makes WTI’s next big move harder to decipher. While gross shorts have been trending higher in recent weeks while gross longs fell, net-long exposure is arguably oversold among traders who a predominantly always net long.
However, given the strong false break of $60 two weeks ago, I suspect prices will hold above $60 and drift up towards $70. But price action on the near term suggests bears want another crack at $60 first.

- Gross short exposure among managed funds and large speculators has been trending slightly higher overall in recent weeks, though both sets of traders reduced short exposure last week (by a combined total of -13k contracts).
- Gross longs have also been falling in recent weeks, though managed funds increased net-long exposure to WTI crude oil by 24k contracts.
- Two weeks ago, large speculators were at their least bullish on WTI crude oil futures since December, while managed funds were at their least bullish since September 2023.
- From this metric, bullish exposure could be seen as oversold, even if short positioning has been rising overall in recent weeks.

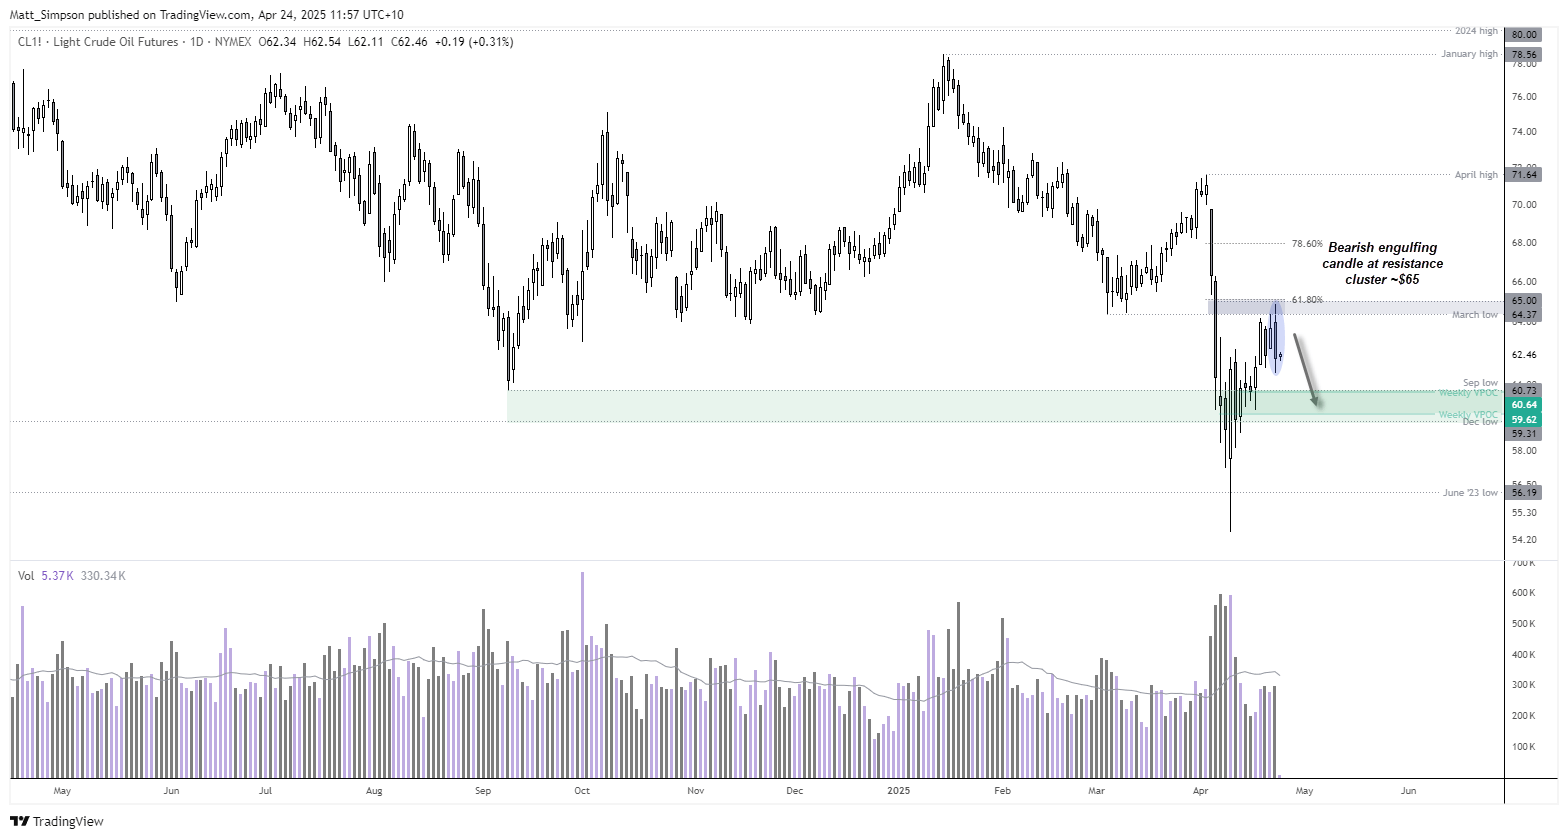
WTI Crude Oil Technical Analysis: Daily Chart
The sharp decline from the April high marks the second leg lower since crude oil topped out in January. However, the momentum during the second leg was notably stronger.
Subsequent price action has been volatile, and while prices have moved higher, bulls have made hard work of those gains. The overlapping nature of the daily candles could suggest this ‘rebound’ is corrective, especially as volumes are also lower.
A bearish outside/engulfing candle formed on Wednesday around $65, near a 61.8% Fibonacci retracement and the March low. The bias now is for at least a move down to $60, though note potential VPOC support levels at $59.62 and $60.64.

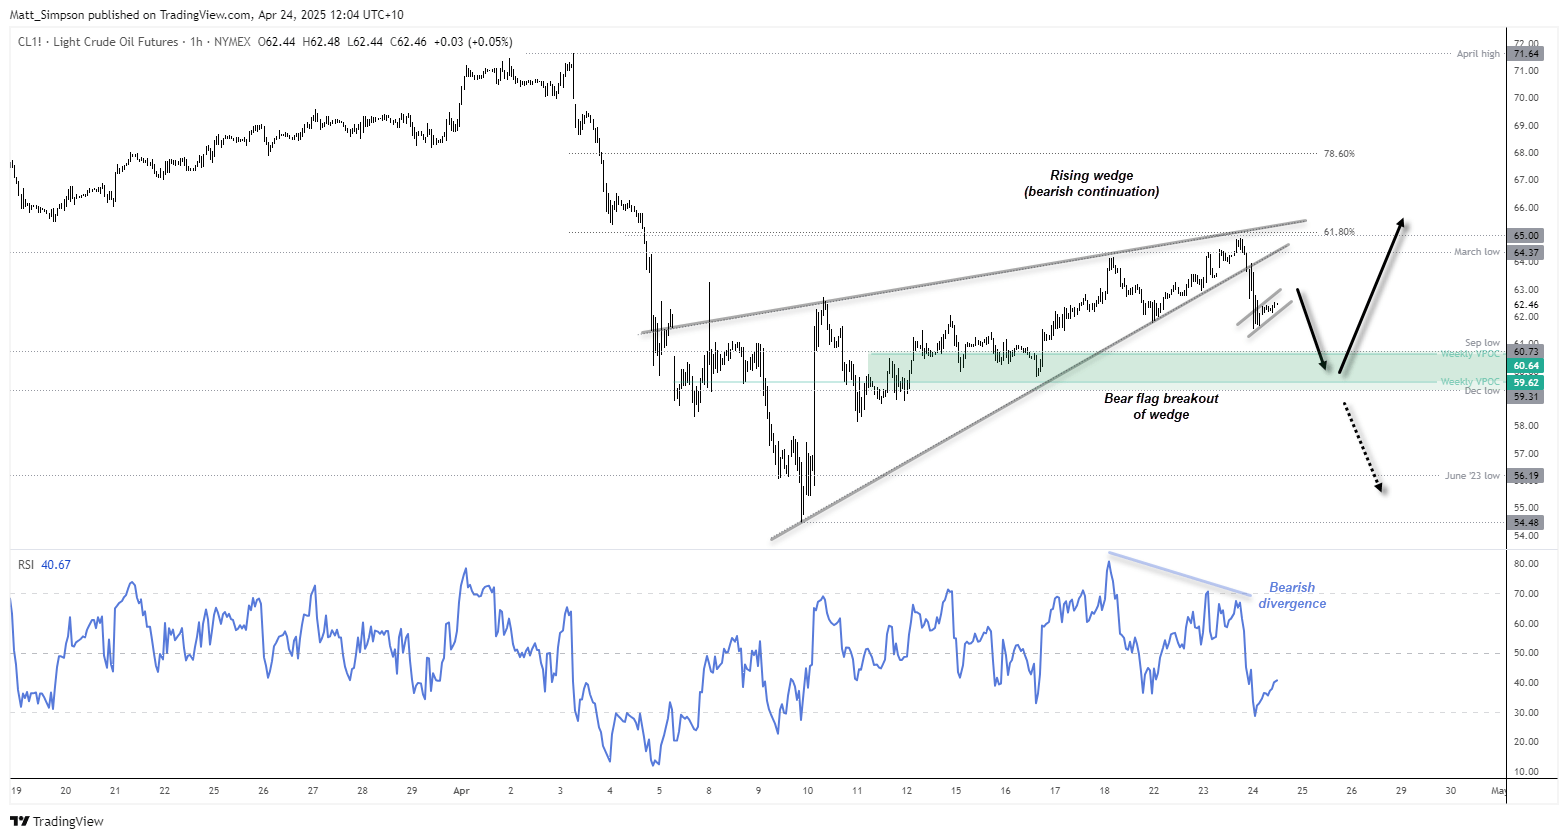
WTI Crude Oil Technical Analysis: 1-Hour Chart
The 1-hour chart shows crude oil prices have broken down from a rising wedge pattern. Such patterns can act as continuation patterns during a downtrend and generate bearish price objectives near the base – which in this case is around $54.50.
A bearish divergence also formed before momentum turned lower. Price action on the 1-hour chart also reveals a smaller flag pattern projecting a downside target just below $60.
While my bias remains for a move to $60, be on guard for volatility around this milestone level.
-- Written by Matt Simpson
Follow Matt on Twitter @cLeverEdge
Latest market news
September 18, 2025 02:48 PM
June 23, 2025 01:22 PM
June 23, 2025 10:39 AM
June 20, 2025 05:23 PM
June 20, 2025 04:46 PM
June 20, 2025 03:35 PM

June 19, 2025 11:09 PM

June 18, 2025 09:32 PM

June 17, 2025 10:59 PM
June 16, 2025 10:27 PM