

View related analysis:
- Japanese Yen and VIX Rise as Wall Street Slips on Weak Bond Auction
- Gold Rebounds, Crude Oil Tests Support as Markets Eye Fed, Trade Talks
- WTI Crude Oil Analysis: Bears Eye Another Assault on $60
WTI Crude Oil Positioning (CL): Weekly COT Report Analysis
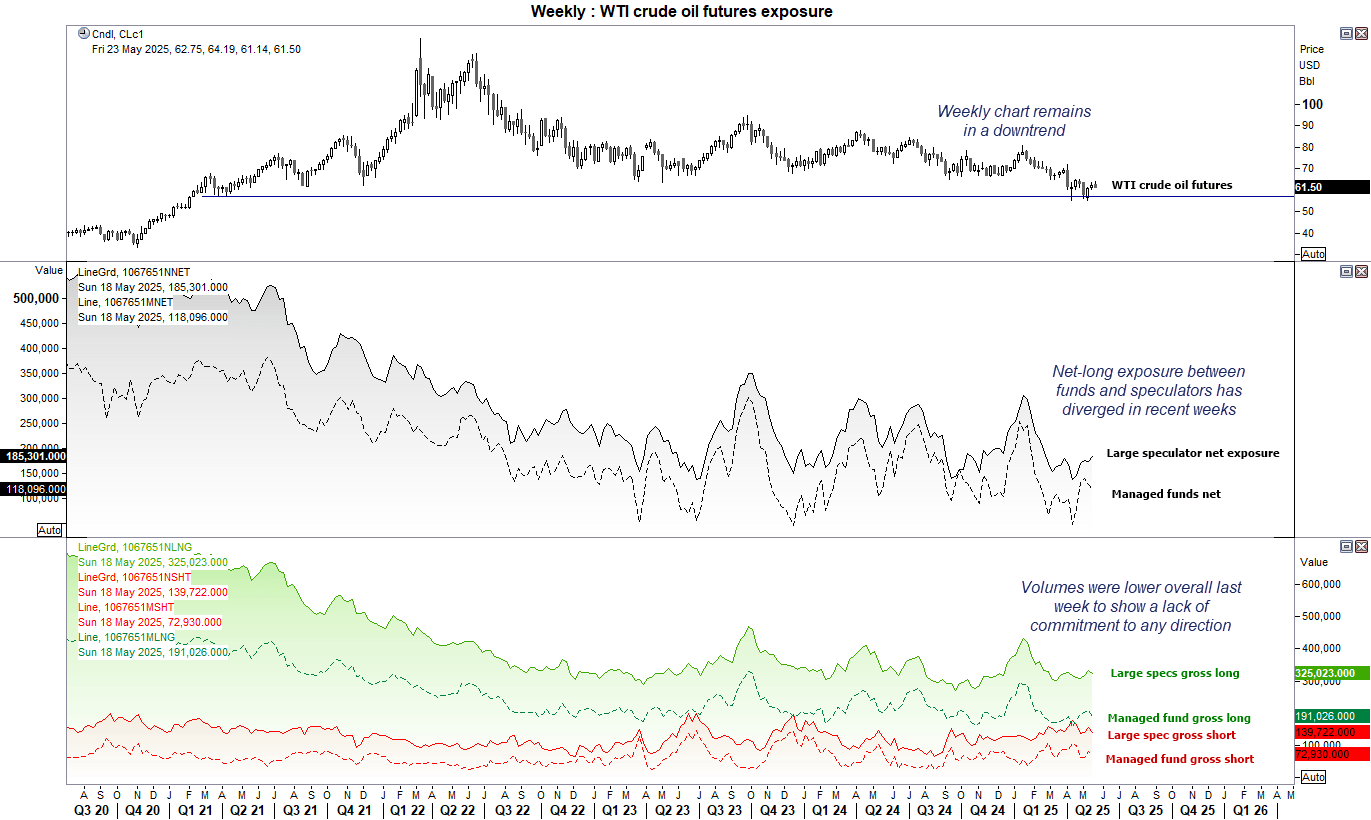
Managed funds and asset managers hold slightly opposing views on WTI crude oil futures. While both groups remain net-long, managed funds have trimmed their net-bullish positioning by approximately 20,000 contracts over the past two weeks, while large speculators have increased theirs by 10,000 contracts. Both sets of traders also reduced gross longs and shorts last week.
With no sentiment extreme to highlight and only marginal shifts in exposure, it hardly screams panic for WTI crude oil traders. However, the divergence in bullish positioning reflects a degree of uncertainty—and the lower volumes suggest a broader hesitancy to commit.
Still, the weekly charts remains in an apparent downtrend, which suggest another cycle low may not be out of the question. WTI crude oil may have already broken out of a bearish pattern on the monthly chart.

WTI Crude Oil Futures (CL) Technical Analysis
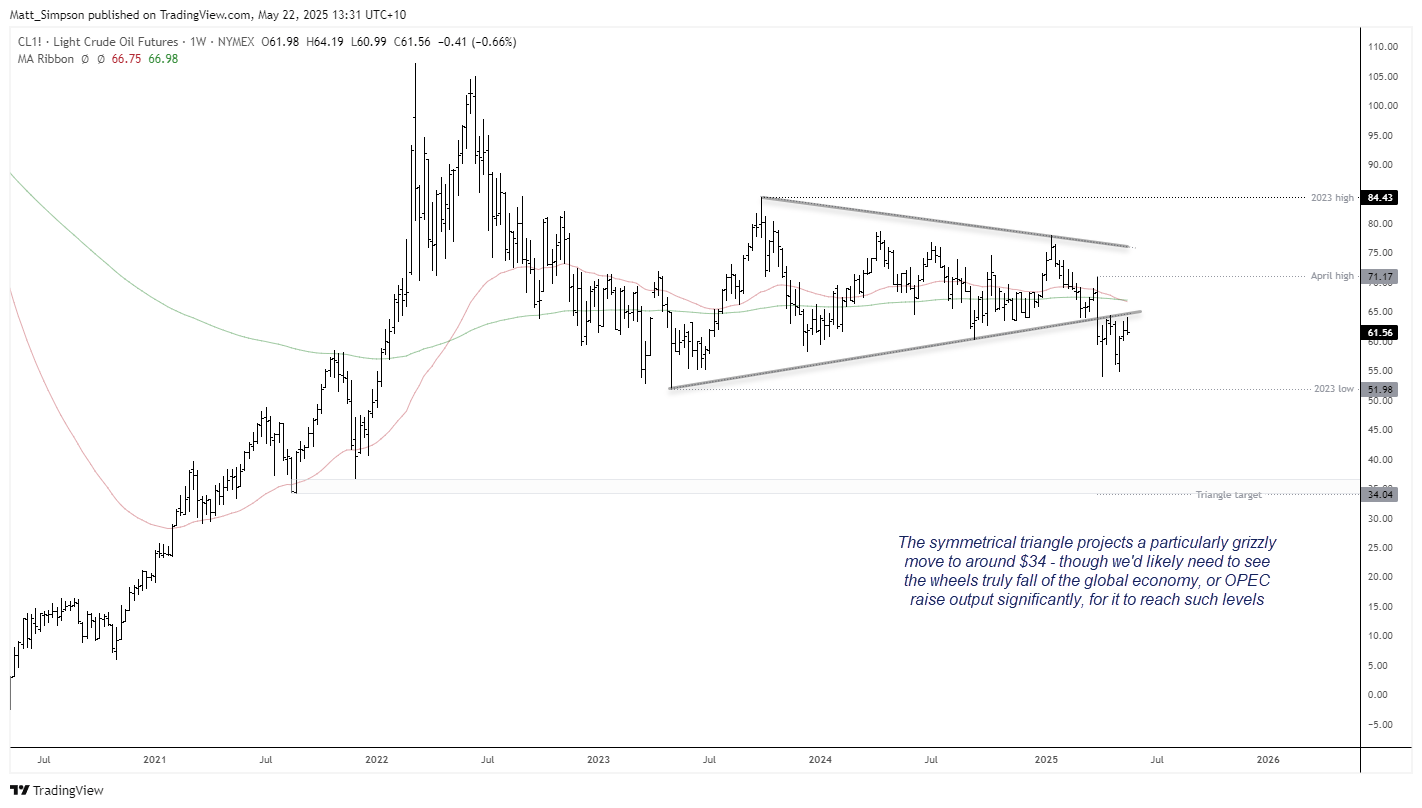
The weekly chart shows that a symmetrical triangle formed on WTI crude oil between May 2023 and March 2024. The near 2-Year pattern projects a downside target around $34. Whether it can reach such a grizzly level is questionable, unless the wheels really do fall of the global economy – or OPEC decide to significantly increase output.
Only time will tell, but a bearish setup may well be on the horizon, at least over the near term.

WTI Crude Oil Futures (Daily Chart)
The daily chart shows that WTI crude oil has rallied 17% from the false break of the 2023 low to Wednesday’s high. However, an elongated inverted hammer has formed, and several resistance levels are clustered in the area. Notably, WTI closed below the 50-day EMA (exponential moving average) after failing to hold an intraday break above it, while yesterday’s high also stalled around the March low. Additional resistance comes from the $50 level, the 61.8% Fibonacci retracement, and a descending triangle trendline—all converging in this zone.
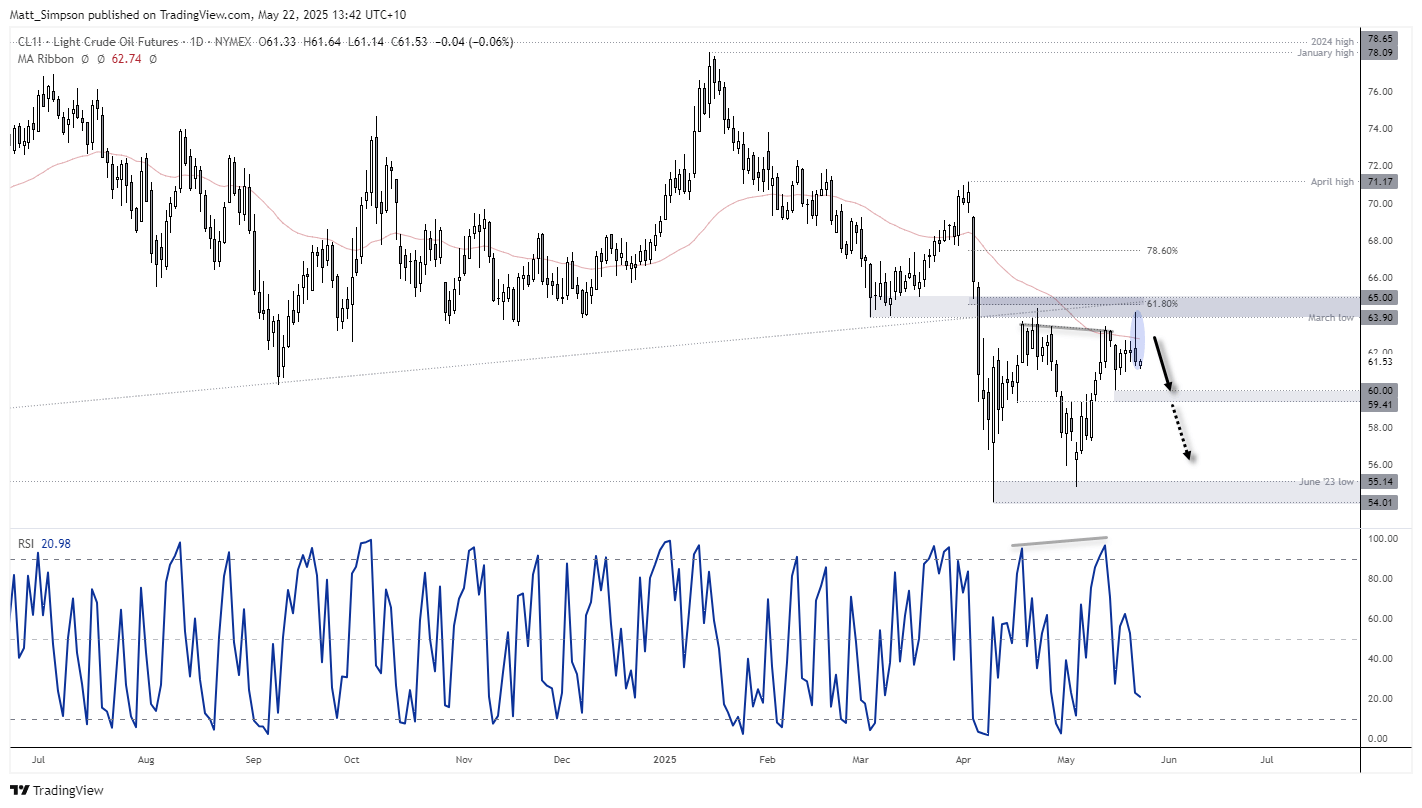
- Bears could look to fade into minor rallies towards the 50-day EMA at 60.74 or even the March high at 63.90.
- The 59.40–60.00 support zone could serve as an initial downside target; a break beneath this area brings 58.00 and the daily opens around 57.20 into focus.
- The bias remains bearish on the daily chart while prices trade beneath the double top near 64.30.
- A break below 54.00 would suggest the next major leg lower is underway, keeping the higher-timeframe channel target of $34.00 in play.
-- Written by Matt Simpson
Follow Matt on Twitter @cLeverEdge
Latest market news
September 18, 2025 02:48 PM
June 23, 2025 01:22 PM
June 23, 2025 10:39 AM
June 20, 2025 05:23 PM
June 20, 2025 04:46 PM
June 20, 2025 03:35 PM

June 9, 2025 09:32 AM

May 12, 2025 06:44 AM
April 27, 2025 02:00 PM