
Q2 2025 AUD/USD Outlook
- Trump’s tariffs remain a fly in the ointment and could easily make or break global sentiment (particularly for commodity FX).
- Prospects of a weaker yuan and stronger US dollar could deal a double blow to AUD/USD bulls.
- The Quarterly CPI figures on April 30 are likely to determine whether the RBA cuts in Q2 or Q3.
- A negative AU-US CESI spread could also cap gains for AUD/USD.
- AUD/USD is expected to range between 60c – 65c in Q2 with a downward bias before bullish interest resurfaces in H2.
Tariffs Remain a Fly in the Ointment for AUD/USD Forecasts
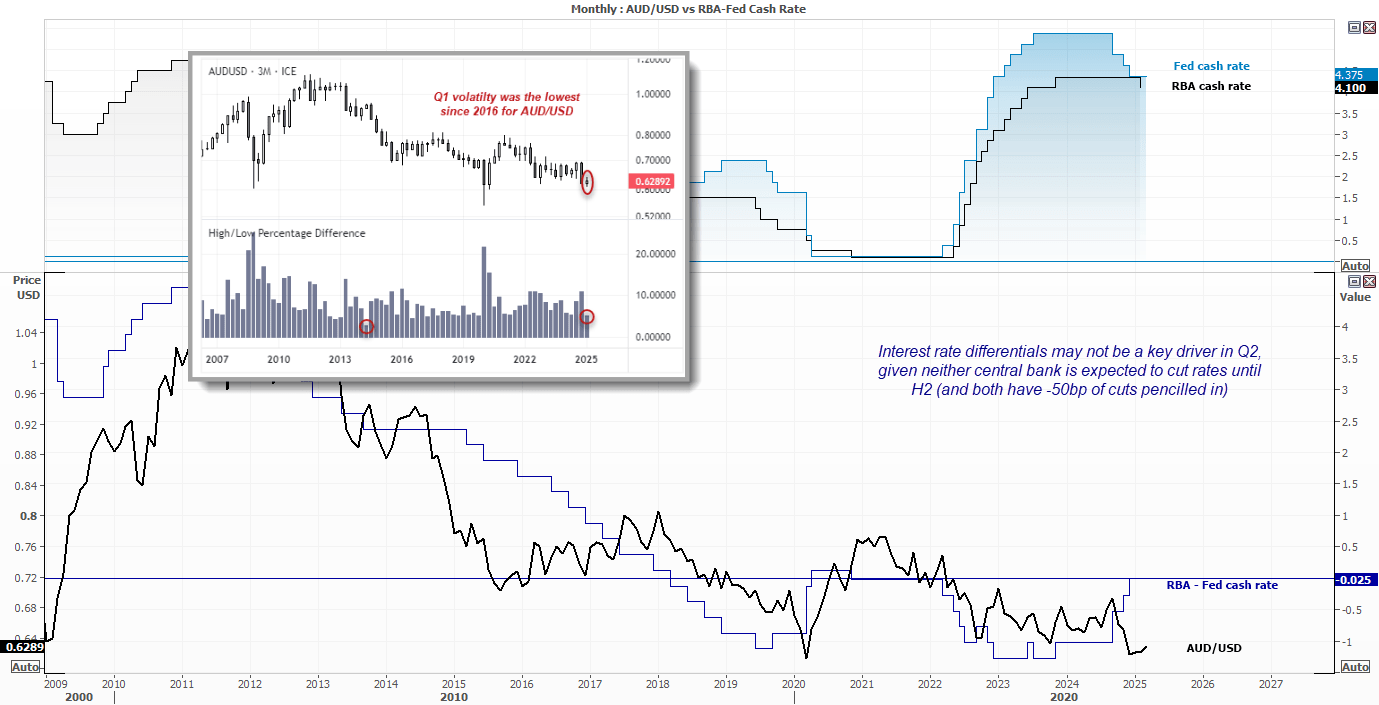
At the time of writing, March 2025, AUD/USD is on track for its least volatile quarter since Q3 2016—a surprising development given the barrage of headlines surrounding global trade tensions, monetary policy divergences, and geopolitical risks.
We’re still awaiting the final outcome of Trump’s tariffs, which are likely to remain a fly in the ointment for most forecasters in Q2. From a high-level perspective, however, they could trigger a rebound in risk sentiment if the tariffs are watered down enough to ease fears of low growth and high inflation.
On the other hand, if Trump plays hardball and is willing to let the US (and, by extension, the global economy) endure the short-term pain of his tariffs, it could further weigh on sentiment and drag AUD/USD lower. I believe we currently sit somewhere between these two extremes, as Trump appears to be using tariffs as a negotiating tool.
Source: Refinitiv, RBA, TradingView
RBA Cuts Are Favoured—But When?
Tariffs aside, the biggest question facing AUD/USD traders is whether the RBA will cut rates again in Q2. While certainly possible, it’s not my base case.
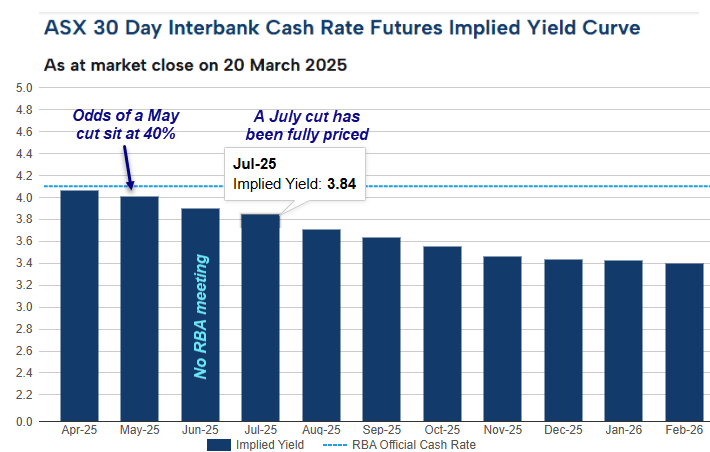
It seems unlikely that the RBA has the appetite to cut rates on April 1, given that it only just cut in February and expressed concern over easing “too much too soon.” The 50bp of cuts indicated in its own forecasts are pencilled in for H2, and its statement left plenty of wiggle room to not honour them.
Source: www.asx.com.au
That said, the RBA’s statement also downgraded inflation to “moderating” from “too high,” acknowledged that upside risks to inflation have eased, and hinted that disinflation may be occurring faster than expected. This leaves the door open for easing sooner if inflation falls fast enough.
This means the quarterly inflation figures on April 30 could be the deciding factor between a Q2 or Q3 cut. As it stands, RBA cash rate futures currently imply a 40% chance of a cut in May, while a 25bp cut is fully priced for July.
Meanwhile, the Federal Reserve kept its Fed Funds projection unchanged in the March meeting, allowing for 50bp of cuts this year, which aligns with the RBA’s forecast. This suggests that interest rate differentials are unlikely to be a key driver in Q2—unless economic data materially weakens for either the US or Australia.
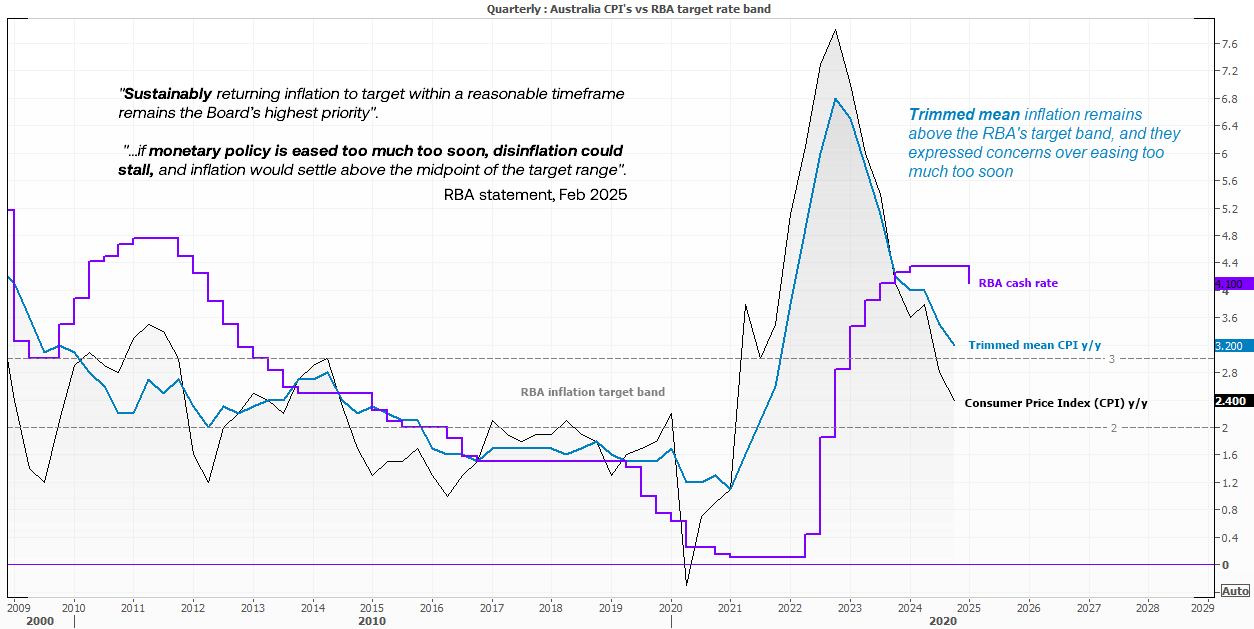
‘Sustainably’ is key for the RBA regarding inflation
Headline inflation sits at 2.4%, just below the midpoint of the RBA’s 2–3% target band. However, the trimmed mean inflation rate—currently at 3.2% y/y—is what the RBA wants to see at these levels.
It is now on the cusp of dipping into the upper bound of the target range for the first time since Q4 2021, which will no doubt spark calls for rate cuts if this trend continues.
However, RBA watchers should remember that the central bank wants trimmed mean inflation to return to target “sustainably,” and cutting “too soon” could undermine its efforts.
Still, with the cash rate at 4.1% and trimmed mean CPI likely to dip below 3%, a July cut seems the most probable outcome—unless incoming economic data deteriorates notably over the next few weeks.
Source: Refinitiv, ABS, RBA
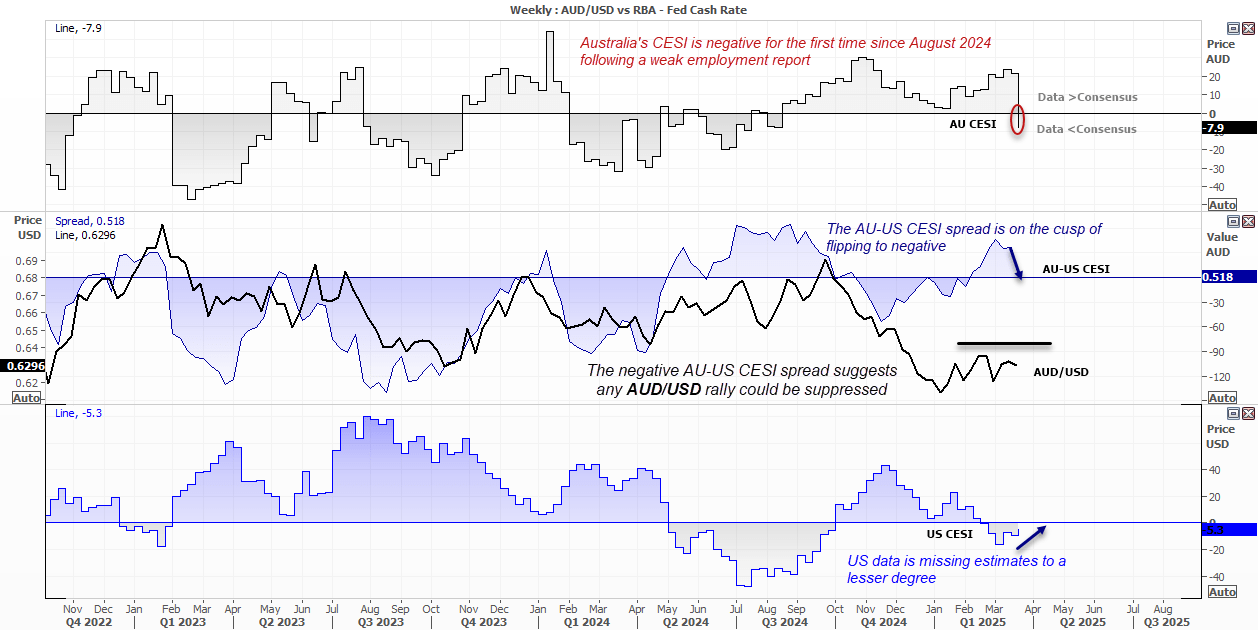
The AU-US CESI Spread Is on the Cusp of Flipping Negative
The Citi Economic Surprise Index (CESI) measures economic strength relative to consensus estimates. A positive reading indicates that data is exceeding expectations, while a negative reading signals that data is falling short. The further the index moves from zero, the stronger the beat or miss.
Australia’s CESI has now dipped below zero for the first time since August 2024, following a weak employment report. While the US CESI is also in negative territory, it is curling higher and appears poised to turn positive.
Moreover, the AU-US CESI spread is on the verge of flipping negative. While this spread does not perfectly correlate with AUD/USD, it visually reflects the challenges AUD/USD bulls may face this quarter and suggests that rallies could be capped.
Source: Refinitiv, Citi
Market Positioning for AUD/USD
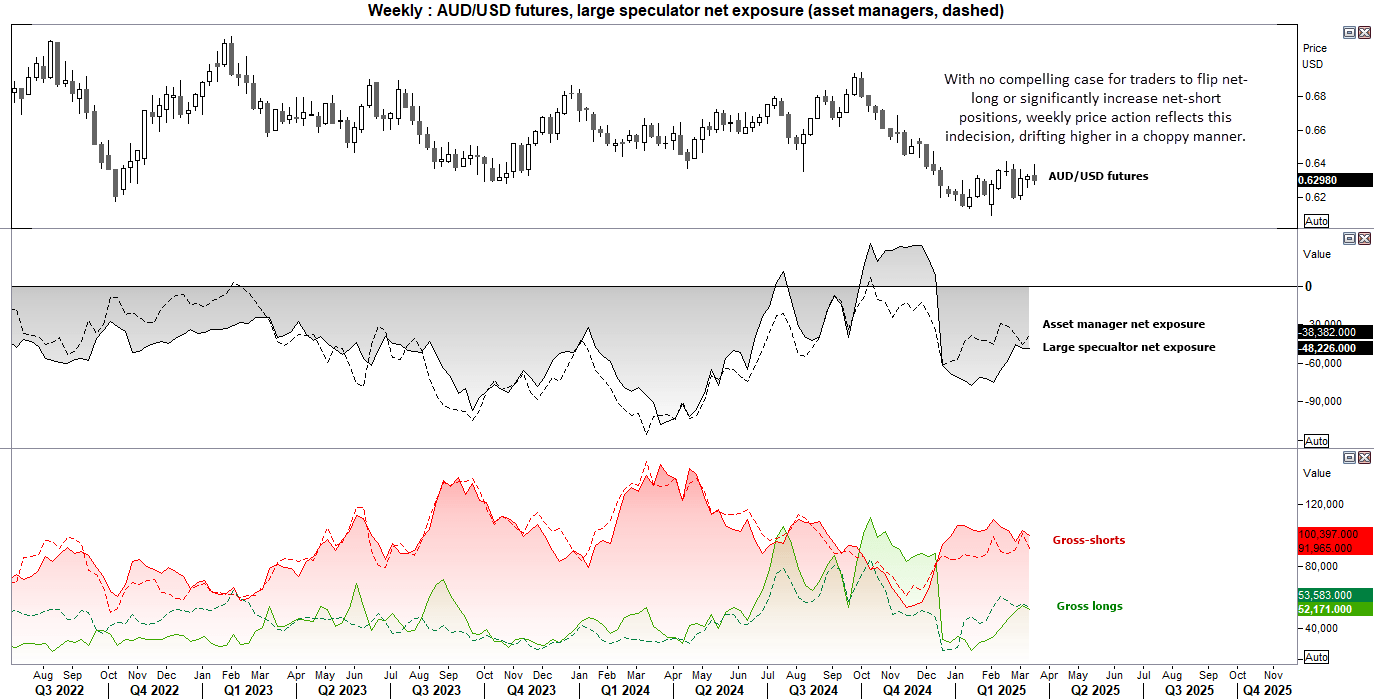
Futures traders remain net-short on AUD/USD, but their exposure levels are neither extreme nor insignificant.
Source: Refinitiv, CME
- Net-short exposure among asset managers peaked in December and has since drifted lower.
- Large speculators saw their bearish peak in January, which has also declined.
- Long bets have been trending higher but remain at roughly half the level of shorts.
- Meanwhile, traders are now trimming both long and short positions, signalling a lack of conviction in either direction.
With no compelling case for traders to flip net-long or significantly increase net-short positions, weekly price action reflects this indecision, drifting higher in a choppy manner. As a result, traders may find it more practical to focus on shorter-term hold times, such as the daily chart or lower.
AUD/USD Scenario for Q2
Most Bullish Scenario for AUD/USD in Q2:
- Trump’s tariffs are not as severe as once feared, inflation cools, and growth prospects pick up.
- The Trump administration deregulates the crypto space and introduces business-friendly policies.
- Australian employment holds up, growth continues to rise, and services-driven inflation perks up, weakening the case for the RBA to cut by 50bps in H2.
- China rolls out new economic policies, boosting sentiment.
Most Bearish Scenario for AUD/USD in Q2:
- Wall Street indices correct further, heading toward the 20% decline threshold for a technical recession.
- Bond yields drop as markets bet that the Fed will be forced to cut rates due to weakening US economic data.
- Australian inflation comes in surprisingly soft, and job growth turns negative for a second month, cementing an RBA cut in May and increasing the odds of 75–100bps of cuts this year.
Most Likely Scenario (In My View):
- Policy expectations cancel out, with the RBA more likely to cut in July and September, while the Fed also cuts by 50bps in H2.
- Tariffs are implemented, but not as severely as feared.
- China continues supporting its economy without delivering a major boost to global growth.
- AUD/USD ranges between 61–65c, with dips being bought toward the lower 60s, yet rallies fizzling out toward the mid-60s.
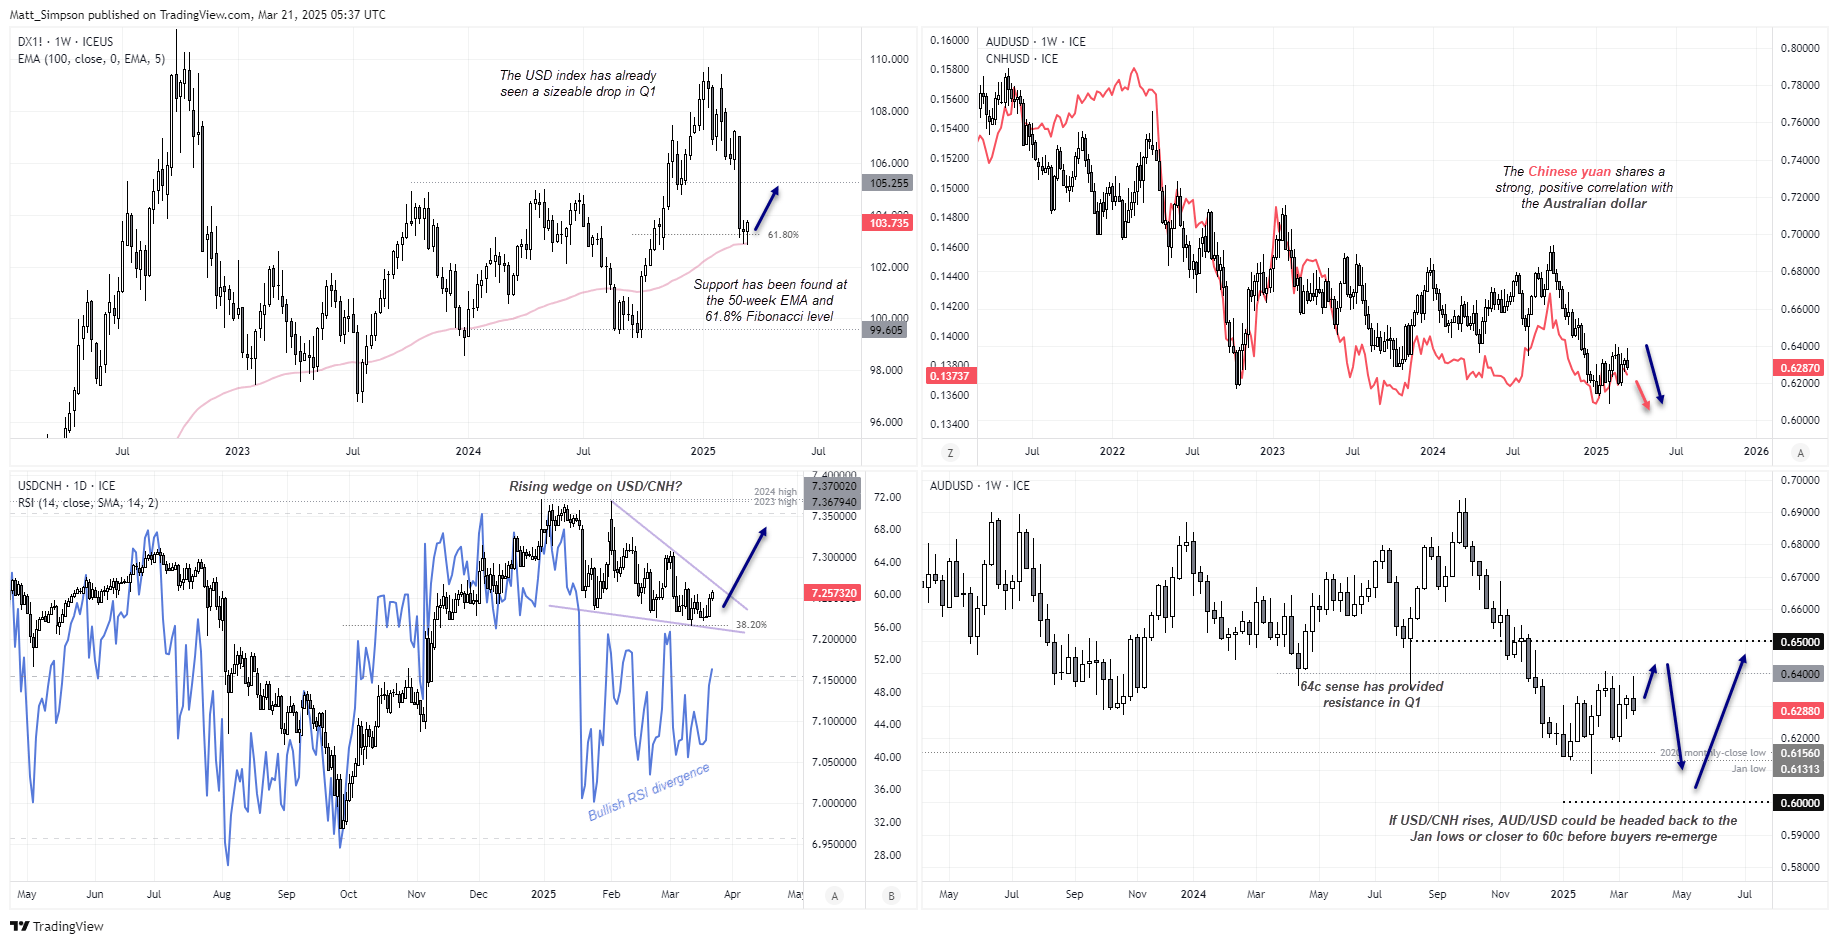
AUD/USD and intermarket analysis
The USD index has already seen a sizable correction in Q1, which I suspect is now vulnerable to some mean reversion higher in Q2. Support has been found at the 50-week EMA and the 61.8% Fibonacci ratio, further adding a case for at least a near-term bounce. While the USD index is heavily weighted towards the euro (by approximately 57%), a stronger dollar could at least cap gains on AUD/USD – if not weigh on it.
The Australian dollar shares a strong, positive correlation with the Chinese yuan. This generally means that a higher USD/CNH results in a lower AUD/USD. It is therefore worth noting that a falling wedge pattern (bullish reversal) is forming on USD/CNH, having already found support at a 38.2% Fibonacci level. A multi-week bullish RSI divergence is also forming. If Beijing allows the yuan to weaken in response to Trump’s tariffs, it could weigh on AUD/USD on the dual combination of a stronger dollar and weaker yuan.
Source: TradingView
A potential bear flag is forming on the AUD/USD weekly chart. 64 cents have proven to be a key resistance level in Q1, though we should add some upside wriggle room to 65 cents in Q2. Overall, given the potential for a stronger US dollar and weaker yuan, a move down to the January lows or even 60 cents could be in order. But as we’ve yet to see AUD/USD cross below 60 cents without a financial catastrophe (Nasdaq bubble, GFC, Covid), the bias is for buyers to re-emerge and support AUD/USD above 60 cents in Q2.
Written by Matt Simpson, Senior Market Analyst
Follow Matt on X: @cLeverEdge