
Q2 2025 Bitcoin Outlook
Bitcoin Key Points
- Bitcoin saw a notable pullback from the lofty, sentiment-driven highs we saw late last year, but the pullback remains well within the historical mid-cycle pullback range.
- Multiple longer-term indicators suggest that we still may not have seen a cycle top in Bitcoin yet.
- To the topside, the next levels to watch are at $108K (2024’s record high) and $123K (the 200% extension of the 2021-2022 drop).
Bitcoin Q1 2025 in Review
Hopes were high as Bitcoin bulls flipped their calendars to 2025, but the cryptocurrency failed to deliver on those expectations in the first quarter of the year.
Perhaps reflecting that broad-based bullish sentiment, our Q1 report was titled “When Will the Bull Cycle Peak?”, and for those who missed the conclusion, it was absolutely not “Already.” As we discuss below, the current ~30% pullback we’re experiencing as of writing in late March is NOT out of character for a mid-cycle dip, but the lack of a positive reaction to the seemingly supportive macroeconomic backdrop is a potentially concerning sign for optimists.
Bitcoin Q2 2025 Outlook
Many analysts have identified a reliable 4-year cycle centered around the Bitcoin Halving that suggests we’re still within a potentially bullish period.
For the uninitiated, the Bitcoin Halving is when the reward for mining new bitcoins is cut in half. This reduces the rate at which new bitcoins are created and thus, lowers the total supply of new bitcoins coming into the market. The halving tends to increase scarcity and historically has led to an increase in the price of bitcoin, though of course it's not guaranteed to do so in the future. As any Bitcoin bull will tell you, the April 2024 halving took the “inflation rate” of Bitcoin’s supply to below 1% per year, less than half of gold’s annual inflation rate.
Looking at my favorite chart, which I colloquially call “The Only Bitcoin Chart You'll Ever Need™”, previous Bitcoin halvings have marked the transition from the (yellow) post-bottom recovery rally stage to the (green) full-blown bull market stage. As Bitcoin continues to mature as an asset class, we’re likely to see smaller percentage moves in each stage even if the general pattern continues to hold (i.e. a 29X rally like we saw in 2016-17 would take Bitcoin over $2,000,000 for an absurd market capitalization of $40T), but the time-based projection for a ~1.5-year bull cycle to late 2025 is developing generally in-line with the 4-year cycle:

Source: TradingView, StoneX. Past performance is no guarantee of future returns.
As we noted in our last report, there are both macroeconomic and “fundamental” bullish arguments for Bitcoin beyond this simple cycle analysis, though it’s critical to watch how those catalysts evolve in the coming quarter and beyond.
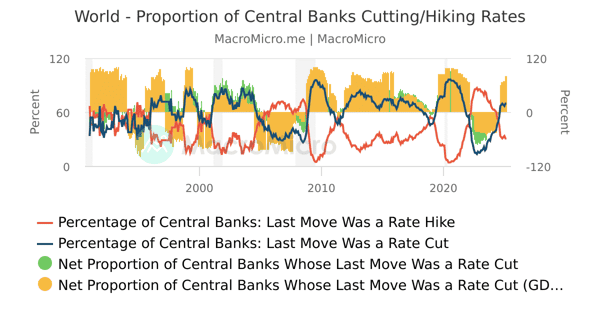
From a macroeconomic perspective, the monetary policy backdrop remains generally supportive, though we may be nearing peak easing globally. As the chart below shows, global central banks have still been cutting interest rates generally, but we have seen that trend stalling in recent months:
Source: MacroMicro
If the nascent trend toward interest rate hikes accelerates (especially if accompanied by pauses or small rate hikes among the major central banks – the Fed, ECB, BOJ, and PBOC) as central banks shift focus back to the risks of re-accelerating inflation, it could develop into a potential headwind for Bitcoin in the latter half of the year.
Likewise, the growth rate fiat money in the financial system is also turning to a more stimulative direction. So-called “M2” is central banks’ estimate of the total money supply, including all the cash people have on hand, plus all the money deposited in checking accounts, savings accounts, and other short-term saving vehicles such as certificates of deposit (CDs).
After falling toward 1% in late-2024, the year-over-year growth in global money supply has re-accelerated over the last few months and is running back above 5% as we go to press:

Source: TradingView, StoneX.
One of the key narratives driving Bitcoin’s value is the idea of “hard money” or a hedge against fiat currency debasement, and as long as the global supply of money continues to increase, that theme could put a floor under the cryptocurrency’s price.
One other narrative that had been driving Bitcoin higher was the potential for the US (and subsequently other developed economies) establishing a “National Strategic Reserve” holding up to 1M Bitcoin. While we did ultimately see a formal announcement in that vein, the details were relatively disappointing, with the US government refraining from any immediate new purchases of the cryptocurrency and merely vowing to hold onto the ~200K that it already held.
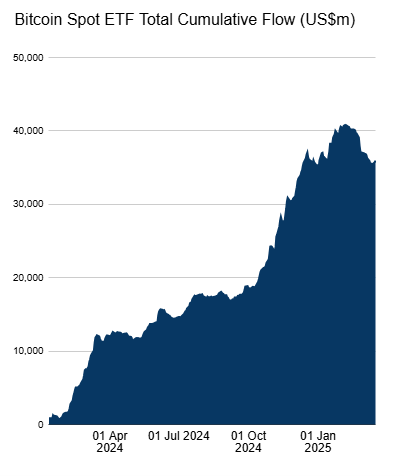
Speaking of large entities accumulating Bitcoin, the impressive inflow of “TradFi” institutional capital into spot Bitcoin ETFs petered out over the last quarter, with total inflows into Bitcoin ETFs reverting toward $35B amidst the Q1 drawdown after peaking above $40B at the end of 2024:
Source: Farside Investors
One key question moving forward is whether ETF purchases will reaccelerate in the coming months or whether “TradFi” investors have already reached their optimal allocation to the asset.
Why Bitcoin Likely Has Not Reached a Cycle Top Yet
Over a longer-term horizon though, there are plenty of indicators that suggest we may still be some distance away, in both time and price, from a cycle top in Bitcoin.
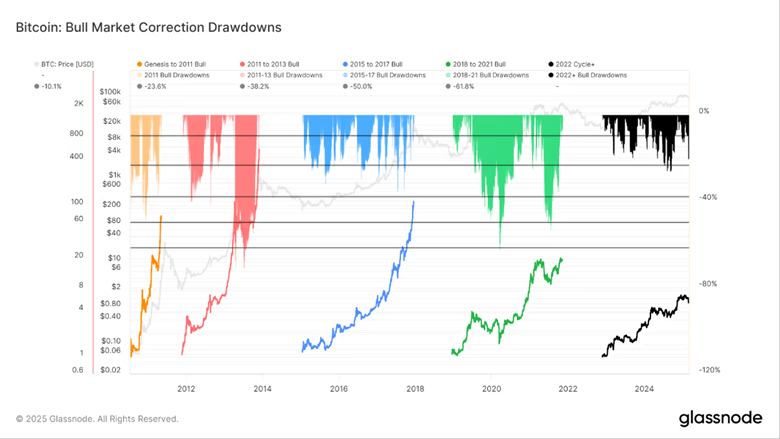
For one, the ~30% mid-cycle drawdown we’ve seen to date would actually mark the smallest pullback that we’ve seen in any Bitcoin cycle to date:
Source: Glassnode
In other words, a 30-50% drop is still “normal” mid-cycle behavior for Bitcoin historically; it’s only if we start to see a move below $50K that long-term investors may start to get spooked.
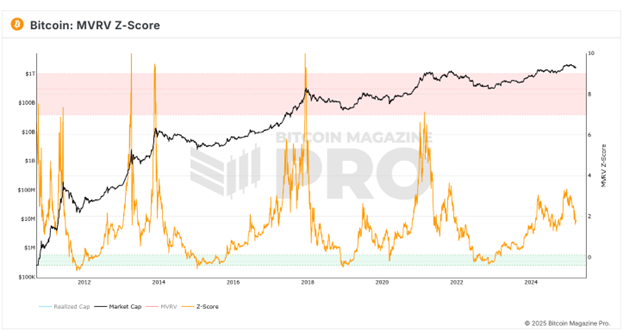
The MVRV (Market Value to Realized Value) Z-score, which compares the current price to the aggregate cost paid for all outstanding Bitcoin, sits near 2, up from the < 1 level that has historically marked bear market bottoms in early 2023 but down from roughly 3 as of late December 2024.
However, as the chart below shows, previous cycle tops haven’t formed until this indicator reaches levels above 7, suggesting that we may still have further to rally before reaching a cycle top (though given Bitcoin’s limited historic record, it’s important to remember that the current cycle may not necessarily match previous patterns):
Source: Bitcoin Magazine. Past performance is not indicative of future returns.
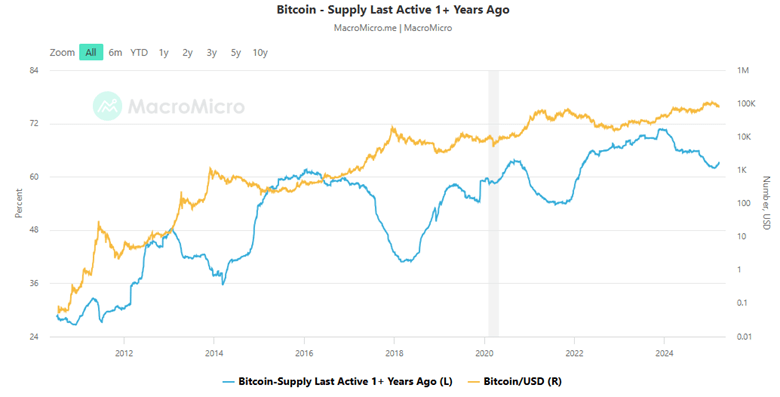
A final consideration is the behavior of long-term holders. As we’ve noted in previous outlooks, those who have held their Bitcoin for more than a year, almost tautologically, are not trying to make a “quick buck” off the cryptocurrency; rather they are more likely to be “true believers” or “HODLers” who are unlikely to sell unless they’re sitting on a truly massive gain.
As the chart below shows, the proportion of Bitcoin that has been held for at least a year started 2024 at record highs above 70% before seeing a notable decline to below 63% at the end of last year. While that 7% drop may seem relatively small, it represented nearly 1.4M in marginal Bitcoin supply, weighing on the Bitcoin price. This measure, by definition, moves relatively slowly, but the recent uptick in longer-term “HODLers” may put a floor under the pullback in the cryptocurrency as we head into the middle of the year:
Source: MacroMicro.me
Of course, the catalysts we highlight in this report may not play out as expected – and to some extent, they may already be priced in so readers should always exercise caution when trading Bitcoin and other cryptoassets. As ever, it will be critical to monitor a broad swath of macroeconomic and crypto-specific metrics as the year develops.
Bitcoin Technical Analysis – BTC/USD Weekly Chart
Source: TradingView, StoneX
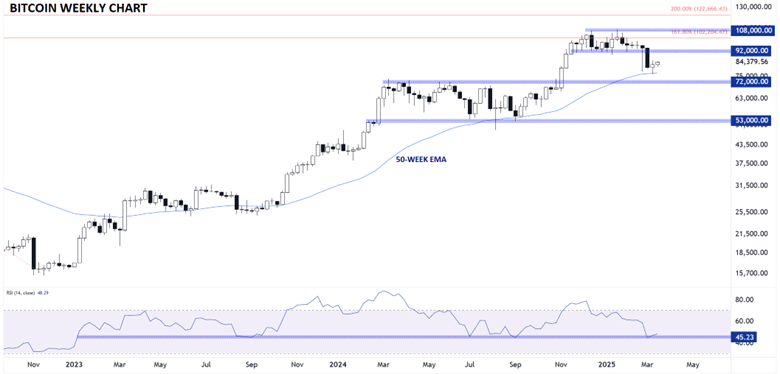
Looking at the longer-term chart, Bitcoin has broken down from its November-February range between $92K and $108K, creating the first meaningful pullback of the bull cycle off the 2022 lows. Notably this pullback has thus far only reached the 50-week EMA, a dynamic support level that has consistently put a floor under prices for two full years now. At the same time, the 14-week RSI has consistently held above 45, providing a potential leading/confirming measure for the uptrend’s strength.
Moving forward, traders will be watching to see if the 50-day EMA, or previous-resistance-turned-support near $72K, marks a bottom for the cryptocurrency this quarter. Only a break back into the $53K-$72K range would flip the longer-term trend to neutral. To the topside, the next levels to watch are at $108K (the previous record high) and $123K (the 200% extension of the 2021-2022 drop).
Written by Matt Weller, Global Head of Research
Follow Matt on X: @MWellerFX
