
Q2 2025 Gold Outlook
After pausing for breather in Q4 of 2024, gold prices continued to soar in Q1 to hit repeated new all-time highs and break key milestones, including the $3,000 barrier, in mid-March. In the last 6 quarters, gold has risen more than 65%. The precious metal has been supported by various factors, including increased haven demand and central bank buying. Heading into Q2, gold’s momentum remained strong, but prices were severely overbought. It is possible that at least some side-ways price action is warranted to ease off gold’s overbought conditions. The key risk to the Q2 gold outlook is if demand for haven assets ease, with Trump vowing to end the conflicts in Ukraine and Gaza. What’s more, the sharp price appreciation all these years means gold miners will be looking to cash in by selling more of the metal at as high prices as they can. The potential for accelerated production growth is a factor that could limit gold’s upside potential. Overall, it is possible Q2 could be slightly more challenging quarter for gold than the recent months.
Trade war uncertainty supports gold outlook
Gold demand surged in Q1 as economic uncertainty deepened amid fears of a global trade war, sparked by Trump’s policies. The administration’s erratic approach—marked by U-turns and delays—left businesses hesitant to hire or invest. With gold being the quintessential safe haven, investors flocked to the metal during this bout of instability. Tariffs, acting as taxes on imported goods, also stoked inflation worries, further supporting bullion. Gold’s repeated gains to fresh highs during this period goes to show investors don’t have much confidence in the people managing the world’s largest economy. It is difficult to see how this source of uncertainty will be removed in Q2.
Central bank buying could slow
Beyond safe-haven flows, there’s been a notable force behind gold’s rally: central bank demand. Institutions like the People’s Bank of China have been quietly accumulating gold. While the exact motivations are murky, it’s reasonable to think diversification away from the US dollar plays a role. There’s also a geopolitical element, as nations seek the security of holding physical assets that can’t be frozen, as Russia’s reserves were.
Data from the World Gold Council shows that central banks snapped up 1,045 tonnes of gold last year—the third consecutive year of purchases exceeding 1,000 tonnes. Will it continue snapping up gold bars in Q2?
With haven demand and central bank buying both firmly in place, I struggle to see either easing significantly in Q2. There is, however, a caveat regarding central bank buying in that with gold prices rising sharply, they may slow down their purchases or even pause altogether until prices dip at least a little. This may slow gold’s upward trajectory.
Can gold continue rising in Q2?
Much of the factors that have helped to support the gold rally will remain in place in Q2. A big reason behind the gold rush has been safe haven demand all these years. From Covid uncertainty in 2020, to the Russia-Ukraine war, the global inflation trends of 2022 and beyond, the crisis in Middle East, and now all the uncertainty about trade war triggered by Trump’s protectionist policies. It was more concerns about the latter that drove gold to new record highs earlier this year. With trade uncertainty unlikely to go away just yet, traders will be keen to pick up gold on any short-term dips in Q2. While we may not see a repeat of Q1 performance, we could nonetheless see dip-buyers emerge on the back of any noticeable retracements.
Keep an eye on the equity markets
Gold’s performance will also depend on the equity markets, albeit to a lesser degree. Since Trump took office, we have seen extreme uncertainty regarding the global trade system. His erratic and aggressive approach to tariffs finally saw US stock markets stop rising further into uncharted territories, with the selling starting in the second half of February before the major indices took a plunge in early parts of March. Equity investors have therefore been demanding a different approach from Trump. Thus, if stock market volatility remains elevated, then investors, who often rush to gold as the choice for haven asset at times of economic uncertainty and market turmoil, may well continue to do so again. Gold is the panic asset of choice, if you will. On the flip side, if Trump decides to support stocks by easing his trade war, then this could trigger another stock market rally in Q2, which could undermine gold as investors rush back to the racier equity markets.
Technical gold outlook: Key levels and factors to watch in Q2
With gold repeatedly hitting new highs and staging only modest pullbacks, there is no question about gold’s trend, which has unambiguously been bullish for a long time now. The question is whether the bullish trend will persist in Q2. As traders, we always favour looking for trades in the direction of the trend unless there is a complete reversal in the trend. That said, we are wary of gold becoming too expensive, too quick. Indeed, the Relative Strength Index (RSI) on the long-term charts of gold remain at extremely overbought levels. At some point, this will need to be addressed. The RSI can unwind through consolidation or a sell-off. Could that be the case this quarter? Given the bullish trend, we favour a modest pullback before looking for new bullish setups. However, our technical gold outlook would turn bearish if and when prices make a distinct bearish reversal pattern.
The monthly RSI has been above the 70.0 threshold ever since April 2024 to rise to 80.00 again. It was last at 80.00 in October, which preceded a two-month pullback in underlying gold prices. That move helped to unwind extremely overbought levels on the lower time frames. Historically, the monthly RSI being at or above 80.00 has consistently preceded either corrections or at least a pullback in gold prices. Before October, the monthly RSI was last at 80.00 at the height of the pandemic. Then, gold went on to consolidate for more than 3 years. Before the pandemic, gold was last this overbought at the peak of the rally that ended in 2011.
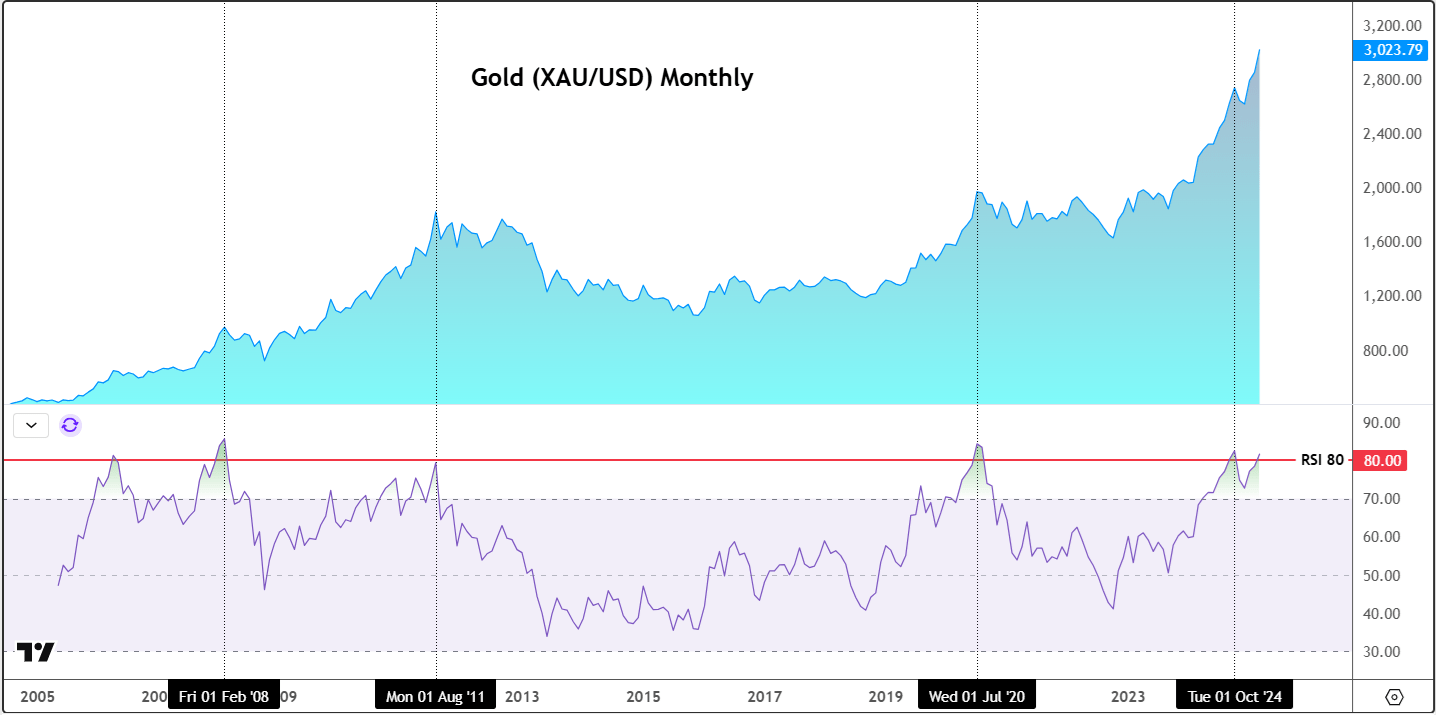
Source: TradingView.com
The weekly RSI had not reached those extreme levels at the time of writing, but at 75.00, it was not far off. At some point these overbought conditions will have to be addressed. If done so through consolidation, this will be considered a bullish scenario. The RSI on its own is not necessarily a “sell” signal, not until we see a corresponding reversal on the underlying gold prices.
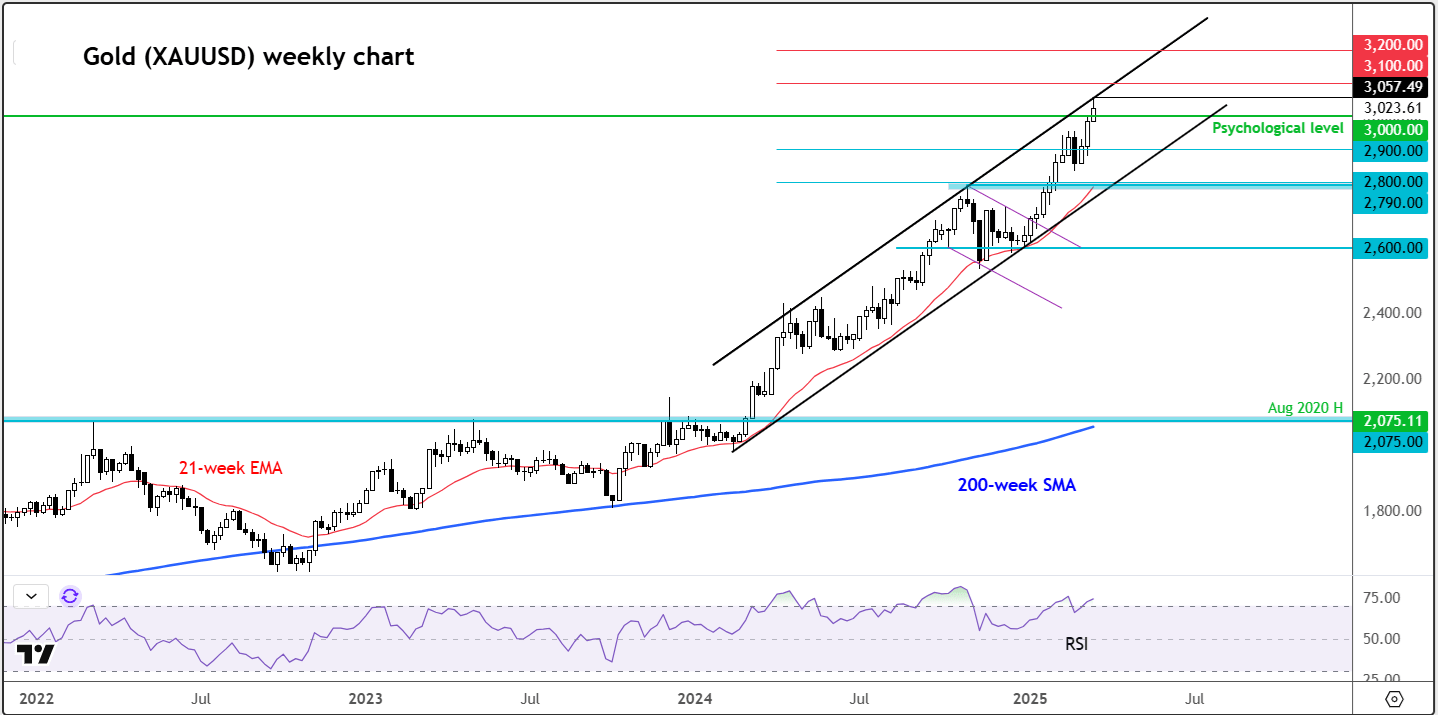
Source: TradingView.com
Another point about gold looking overstretched is the fact that it was nearly a whole $1,000 above its long-term 200-week moving average, which stood at near long-term support in the $2070-$2075 range. It was nearly 50% away from this average, reflecting the recent price appreciation. With the trend being so strong, we would favour looking for dips to be supported near the faster moving 21-week exponential average. As it happens, the latter comes in around the $2800 area, which also corresponds with the support trend of the bullish channel that has been in place since early 2024.
Thus, should gold weaken in Q2, we would potentially look for a bottom to form around the $2800 area. But if gold breaks the support trend of the bullish channel decisively, then our technical gold outlook would turn bearish in the short-term. In that potential scenario, we would favour looking for bearish setups to form around broken support levels. But we will cross that bridge if and when we get there.
Written by Fawad Razaqzada, Market Analyst
Follow Fawad on X: @Trader_F_R