
Q2 2025 Indices Outlook
U.S. Equities Forecast for Q2, 2025: S&P 500, Nasdaq 100
It was a rough quarter for the S&P 500 and the Nasdaq, as each index showed its first quarterly loss in more than two years.
Talking Points:
- As we move into the end of Q1 both SPX and the Nasdaq 100 are showing their first quarterly loss since 2022.
- The tension has built around the tariff topic in the United States and this can keep the pressure on tech stocks that were high-flying into the New Year open.
- SPX can still retain attraction for pullback themes, especially given the possibility of softness from FOMC policy. There’s a major support zone sitting just below the recent lows of the index and that retains potential for bounces if it comes into play.
There remains a wall of risks for stocks as we move into Q2 of 2025 and as looked at in the yearly forecast, the high-flying tech stocks that drove the bounce from the 2022 lows have come under fire through the first quarter of the New Year. Perhaps the largest surprise so far in 2025 has been the lack of bullish drive coming from the executive branch of the United States, as equity rallies tended to be followed by tariff talk, which functioned as a wet blanket on stock gains.
The ongoing theory that President Trump is instead focusing on the bond market and longer-term yields would mean that he would be at peace with moderation in equity prices in the near-term. This, of course, would be in anticipation of greater gains ahead as pushed by lower bond yields that can support a more robust housing market and a stronger risk-on environment for equities. Given the mass of Treasuries coming due later in the year that will need to be refinanced, this theory is not without some supporting detail.
Reiterating what I had said in the 2025 Forecast for equities, I think that SPX could remain attractive after pullbacks. The Nasdaq 100, however, appears to be a bit more volatile on that theme and given the rampant gains in AI names that showed into 2025, the index would seem to be more vulnerable should equity sell-offs deepen.
Q2, 2025 Fundamental Forecast for Equities
The rally in stocks from the 2022 lows had become quite stretched as the New Year open neared. But there was still no clear evidence that the run was yet over, and the post-election euphoria had taken hold in U.S. markets, seemingly driven by the expectation for President Trump to do what he had done for much of his first term, which was to drive equities higher with a near constant stream of optimistic comments around and about American corporates.
That’s been perhaps the most surprising aspect of the new President’s first two months in office, as those comments have been noticeably missing and, instead, there’s actually been some bearish innuendo, such as the episode in which he was asked about the possibility of a recession. He hesitated, and then gave an opaque and winding answer, with markets soon selling off on the back of that comment.
Perhaps more noticeable is the fact that on equity bounces President Trump has shown a proclivity to talk up tariffs, which markets have been treating in a bearish manner with respect to stocks. And that tariff topic presents several possible curveballs into the mix, as the Fed’s updated projections at the March rate decision showed both lower growth expectations and higher inflation expectations, which could hinder the bank’s ability to support the economy with more rate cuts should a larger economic slowdown present itself. And for a globalized economy in which American corporates export and benefit from international markets, there’s a giant question mark as to impact of tariffs and which companies would get hit hardest or by how much.
There’s just quite a bit of unknown around the topic and that’s why it’s dominated headlines in Q1, and that’s seemingly produced more confusion with both consumers and investors and that’s only furthered the challenge of market participants to mount any significant rallies. It’s notable that markets rallied through the initial tariff date on Canada and Mexico of February 1st, but as the U.S. President started taking a harder line on global tariffs and European trade partners in February, that’s when equities started to struggle.
There was another factor that appeared in Q1 that contributed to the sell-off in stocks, and that’s the possibility of recession. The Atlanta GDP Now indicator dipped down to a low of -2.8% in early-March, and that helped to drive a deeper sell-off in stocks to go along with a bearish move in the U.S. dollar. This will remain a hot button topic as we move into Q2, particularly as the opaque topic of tariffs remains a key driver. Reciprocal tariffs are set to come into play shortly after the Q2 open so the fundamental side of the equation can remain a busy matter as we treated into the second quarter of the year.
2025 Technical Forecast for Equities
In SPX, it was only a couple of weeks into the New Year that the first support zone came into play. This support was generated from the election gap, which held the lows for SPX on January 13th as bulls re-entered the equation, eventually driving up to a fresh ATH that was established on February 20th. That all-time-high printed right at the 100% extension of the 2022 sell-off, and that’s the point where sellers started to take over in a more aggressive fashion. Price has since slipped down for a test of the ‘s2’ zone looked at in the 2025 forecast.
SPX Daily Price Chart
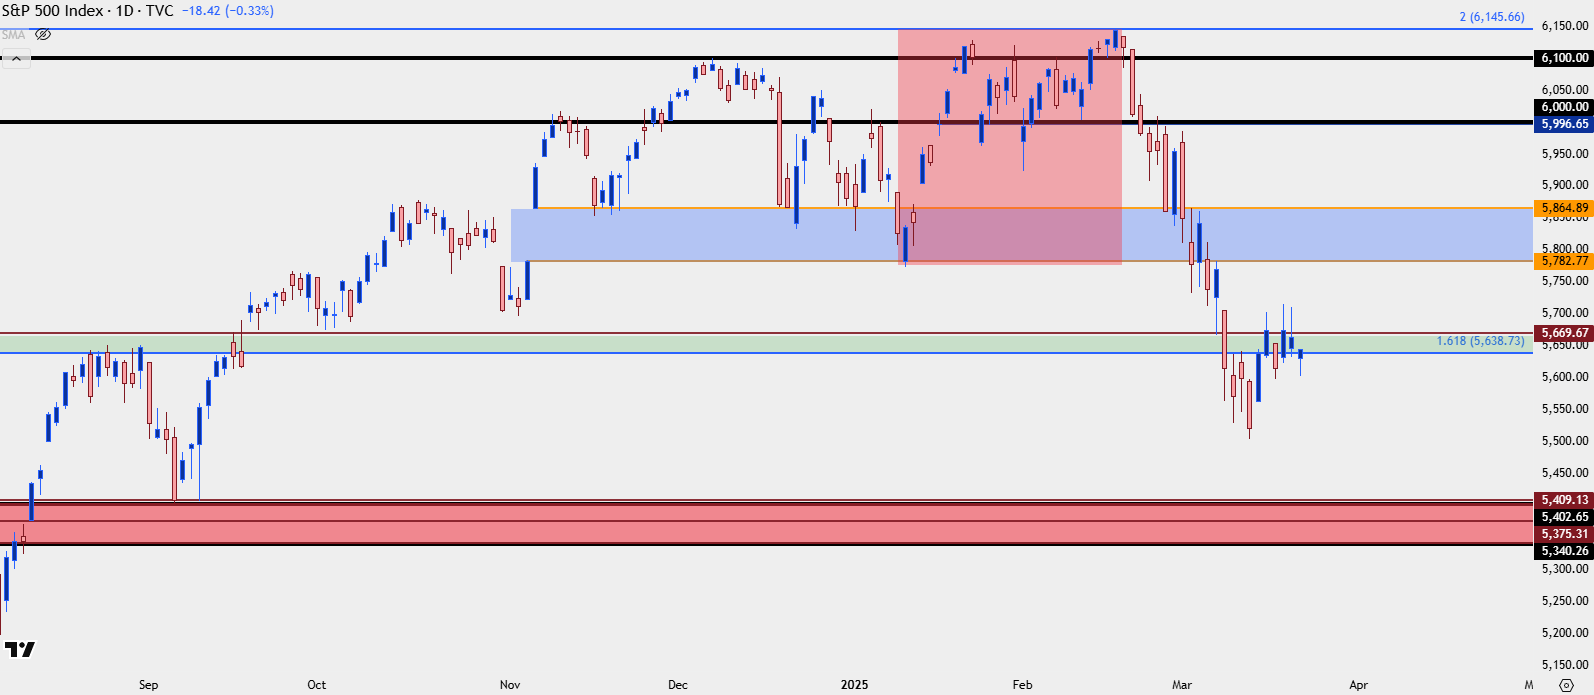
Chart prepared by James Stanley; data derived from Tradingview
S&P 500 Support Tests
As I write this with a little more than a week left in Q1, it’s too early to say that the ‘s2’ zone won’t lead to a bounce in the index and the current weekly bar is showing as both a doji and a higher-low from the prior week, both of which can support a push back up to the 5782-5864 zone.
But from the weekly it’s also evident that the third support zone for the index could soon be in-play, and this is a zone that had quite a bit going on when equities turned in Q3 of last year. This plots from the prior swing high or 5340 up to 5402, and this was the last spot of support in September before SPX launched up to a fresh ATH.
If that zone cannot hold, however, we’re probably going to be seeing a steeper decline in the Nasdaq 100, which I’ll look at in more detail below.
SPX Weekly Price Chart
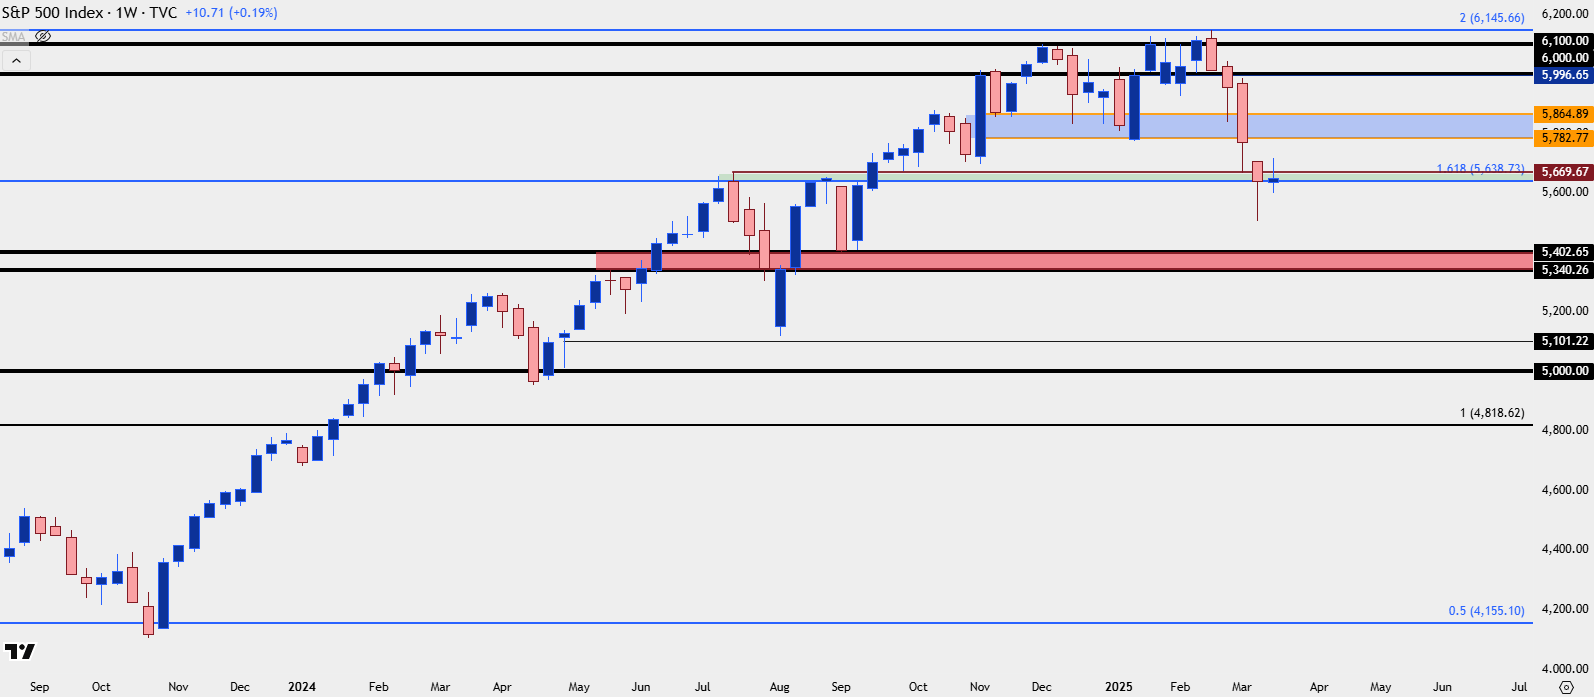
Chart prepared by James Stanley; data derived from Tradingview
Nasdaq 100
In the 2025 forecast for U.S. equities, I highlighted massive moves in both NVDA and Tesla. Those moves had large impact on indices, as well, as they’re two of the larger components of both the S&P 500 and the Nasdaq 100. The first quarter was not friendly to either company and, similarly, the Nasdaq 100 has taken a sharper turn-lower to go along with that backdrop.
Until we see the tariff topic settled and a more confirmed sign of impending rate cuts from the Federal Reserve, I think that tech stocks can remain as vulnerable and that can make the Nasdaq 100 as a less attractive venue to plot for bounces.
The 20k level was a big spot of reference for the index and despite a failed attempt from bulls to hold support there, price has since sliced through. With that said, I am going to retain the supports looked at in the 2025 forecast, plotted at 18,416-18,371 and 16,764-16,969.
Nasdaq 100 Weekly Chart
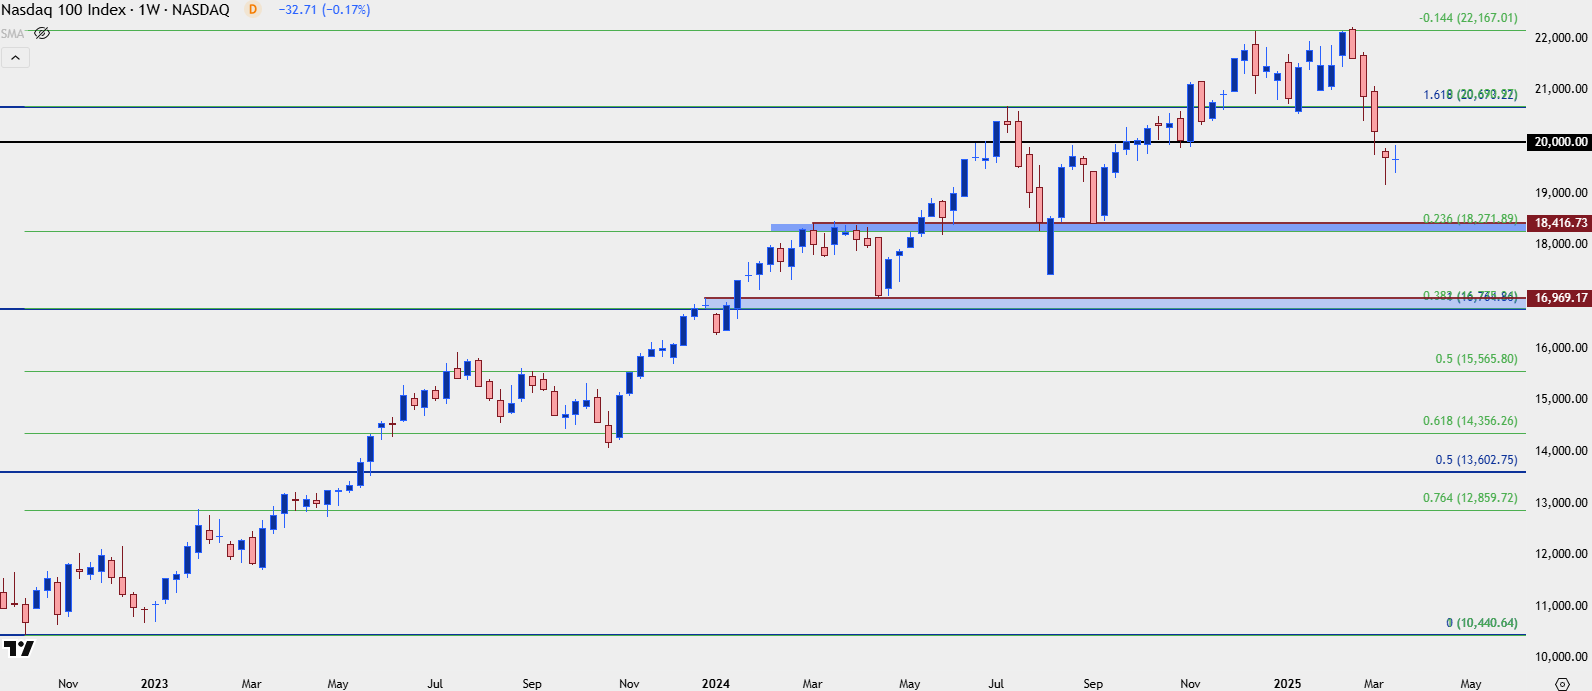
Chart prepared by James Stanley; data derived from Tradingview
Written by James Stanley, Sr. Strategist
Follow James on X: @JStanleyFX