

The Australian dollar was higher across the board last week, and made notable ground against safe havens such as the Swiss franc and Japanese yen. Appetite for risk was restored after Trump seemingly scaled back his aggressive approach to trade negotiations. AUD/USD rose for a third consecutive week, though it was the least volatile of the three as the V-bottom rally loses steam. Resistance also looms for AUD/USD. AUD/JPY also rose for a third week, while AUD/CHF was higher for a second.

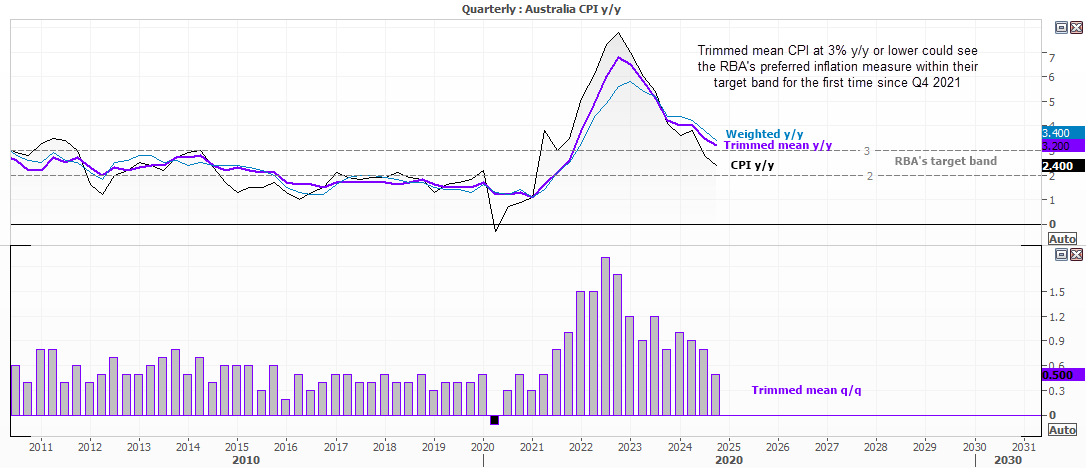
Australian Trimmed Mean Inflation in Focus
RBA cash rate futures currently imply a 62% chance of an RBA cut in May, and those odds are likely to increase further should trimmed mean inflation dip to 3% y/y or lower. At 3.2% in Q1, trimmed mean inflation was at its slowest pace since Q4 2021, and the quarterly print of 0.5% was its lowest since Q3 2021. So, unless there is a nasty surprise to the upside, the RBA seem likely to cut their cash rate by 25bp to 3.85% on 20 May.
The cash rate curve has nearly priced in another 25bp cut to arrive in July, and the end-of-year rate is expected to be 2.9% – or 115bp beneath the current cash rate of 4.1%.
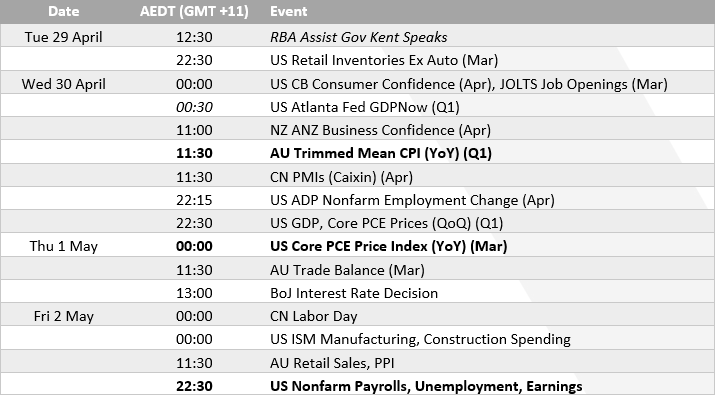
US GDP, PCE inflation, NFP on Tap from the US
Attention then shifts to the US, with a trifecta of big reports on the menu including GDP, PCE inflation, and nonfarm payrolls. Q1 GDP and inflation data for March land within 90 minutes of each other, which could leave AUD/USD vulnerable to some whipsaws on Wednesday night. Fed funds futures currently imply a 58.6% chance of a 25bp Fed cut in June, though those odds could be reduced if inflation has an upside surprise up its sleeve.
It will be interesting to see if Trump’s trade war begins to show up in employment data. NFP data has generally been solid overall and has been a key reason why the Fed has maintained higher interest rates. So it might not take too much of a miss for traders to get excited over a potential cut (and I am sure Trump will waste no time publicly pressuring the Fed to act).
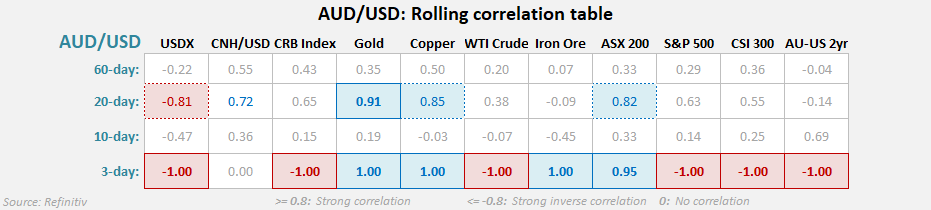
AUD/USD correlations:
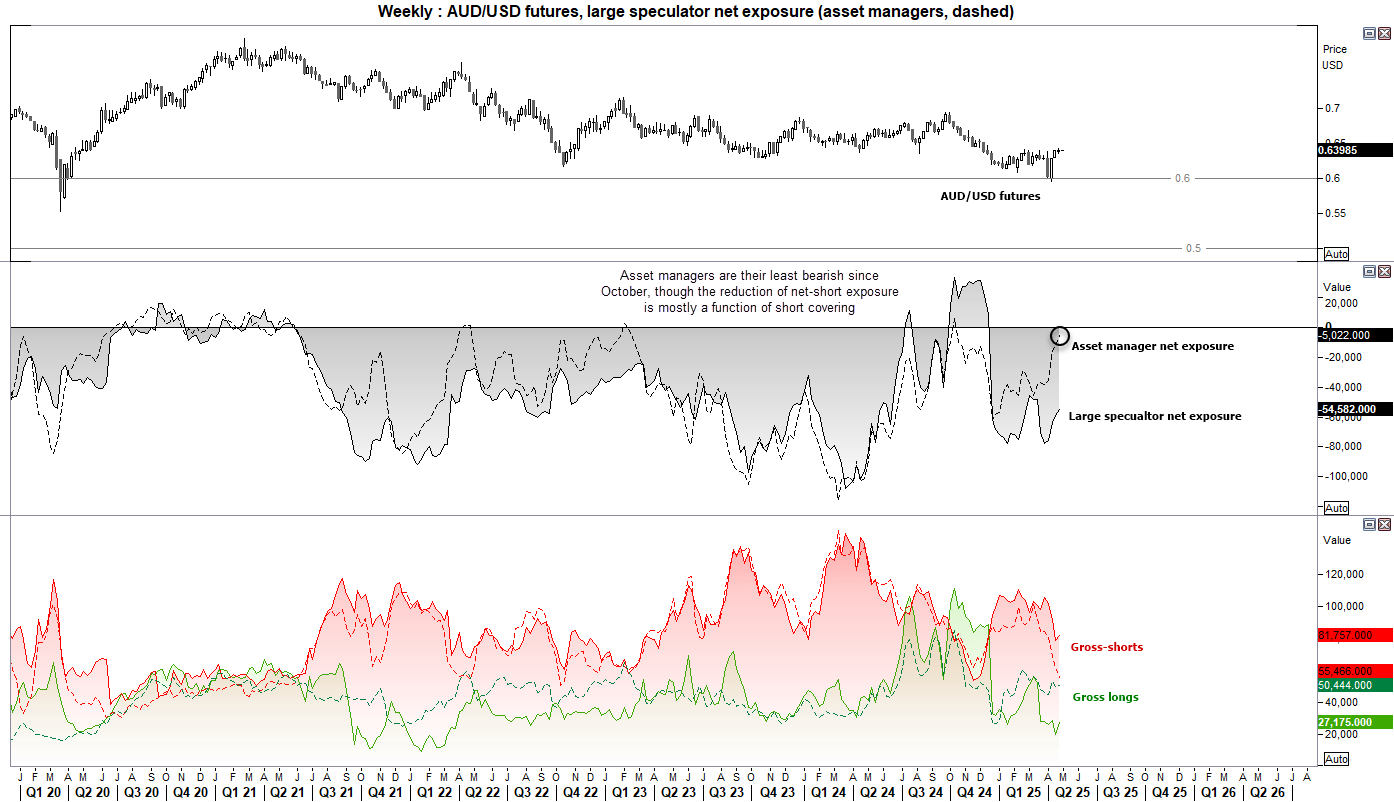
AUD/USD Futures – Market Positioning from the COT report:
Asset managers are on the cusp of flipping to net-long AUD/USD exposure. With a current net-short exposure of just 5k contracts, this is their least bearish level since October. However, this is mostly a function of short covering, as gross longs are not trending higher, and they have reduced their gross short exposure for four consecutive weeks, or six of the past seven.
Large speculators have also reduced their net-short exposure for a fourth consecutive week, though they remain heavily net-short the Australian dollar by -54.5k contracts.

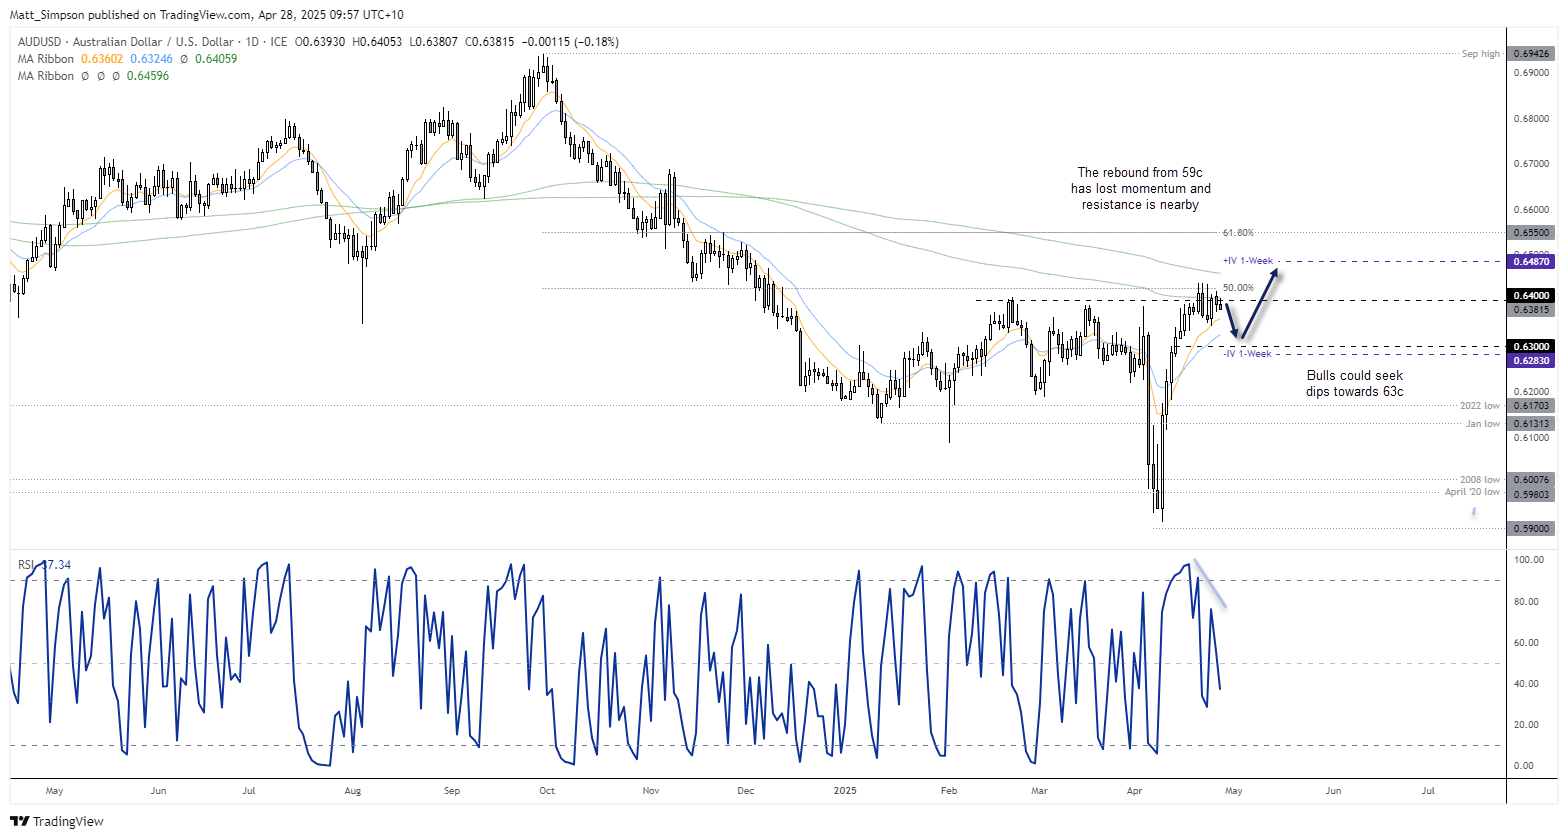
Australian Dollar (AUD/USD) Technical Analysis
It has been three weeks since the Australian dollar was close to breaking beneath 59c. Yet its near 9% rebound has seen AUD/USD consider a break above 64c. The V-bottom recovery suggests the 0.5914 low to be significant, but it seems a pause is necessary before its bullish move resumes. A doji also formed last week to underscore hesitancy from bulls to push immediately higher.
The daily chart shows resistance was found around the 50% retracement level and 200-day EMA. Yet the 10-day EMA is also providing support. The 1-week implied volatility band sits at 0.6283 to 0.6487. We could be in for a quiet start to the week given the lack of calendar events ahead of Wednesday’s Australian CPI report, with US GDP and PCE inflation arriving later that night.
If AUD/USD treats us to a pullback, I would seek evidence of a swing low around 63c on the assumption that the rally will extend and break above 64c. For now, intraday setups are preferred within last week’s range, with a break beneath 0.6348 required to assume a deeper pullback to 63c.
-- Written by Matt Simpson
Follow Matt on Twitter @cLeverEdge
Latest market news
September 18, 2025 02:48 PM
June 23, 2025 01:22 PM
June 23, 2025 10:39 AM
June 20, 2025 05:23 PM
June 20, 2025 04:46 PM
June 20, 2025 02:18 PM

June 19, 2025 09:09 AM

June 18, 2025 02:55 PM

June 18, 2025 08:19 AM

June 18, 2025 02:21 AM