

View related analysis:
- EUR/USD, Dollar Index, VIX Analysis: COT report
- AUD/USD weekly outlook: RBA, ISMs and NFP in Focus
- If Consumers Don’t Consume, a Recession Could be Presumed
- Nasdaq 100, S&P 500 Feel the Force of Trump’s Tariffs, ASX to Open Lower
It was a volatile end to a volatile quarter for the S&P 500 and Nasdaq 100, which suffered their worst quarter in 11. S&P 500 futures were down -5.7% in Q1 and the Nasdaq fell -9.5%. Trump’s tariffs have of course been a key driver for the underperformance of risk in Q1, with incoming data also fanning fears of stagflation in the US. Still, with end-of-month and end-of-quarter flows also to contend with, Wall Street managed to post a defiant bounce on the last day of the quarter to recoup some of its earlier losses, on the eve of Trump’s Liberation day.
The Canadian dollar and US dollar were also caught in the crossfire of Trump’s tariffs, with the commodity currencies succumbing to the strength of the US dollar. This saw AUD/USD fall as much as -1.3% on Monday and USD/CAD rise 0.7%, and there relative performance could provide clues for AUD/CAD bears.
AUD/USD, USD/CAD technical analysis
The Australian dollar broke beneath its Friday 21 March low, which opens up a run to the 62c handle. It wasn't too far off reaching it before a late-day pullback, but prices remain beneath that swing low to suggest there could be another attempt at hitting 62c. If the RBA surprises with a dovish tone, we could see AUD/USD reach 62c today. But given my bias of a bullish US dollar, at least in the early stages of Q2, I suspect AUD/USD might even try to head for the 2020 monthly-close low around 0.6156.
But before I get carried away, we'd likely need to see USD/CNH perform a strong rally before assuming AUD/USD stands any real chance of heading into the upper 50s for any extended period of time.

The Canadian dollar closed higher for a fourth day but accelerated away from its 20 and 50-day EMAs. A falling wedge pattern is now in play which assumes an upside target near the base of the pattern. The 1.45 handle seems like a logical first target.
Had the falling wedge pattern formed in a stronger part of a bullish trend, I would also assume a breakout of the cycle high. But the fact is that USD/CAD has been trading sideways this year, and futures traders are continuing to shy away from shorting the Canadian dollar.

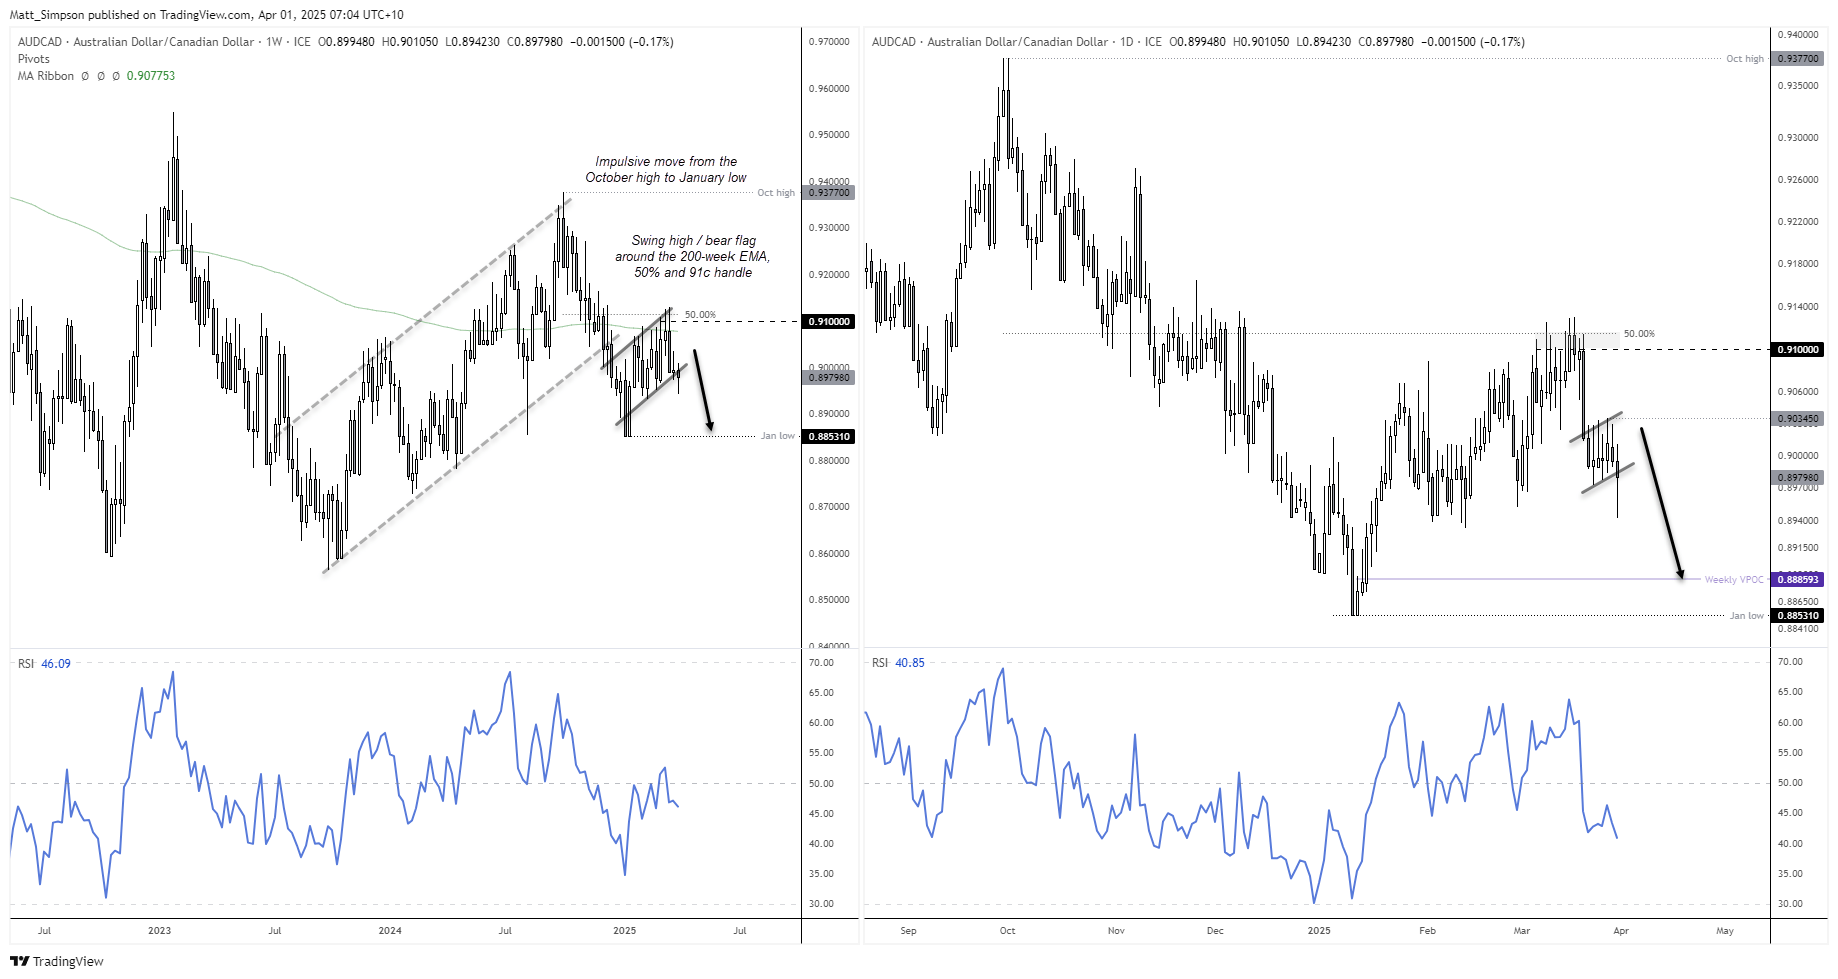
AUD/CAD technical analysis
A potential bear flag has formed on the AUD/CAD weekly chart. What I particularly like about this chart is how the highs of the flag stalled around the 200-day EMA, 91c handle and a 50% retracement level. The preceding move from the October high to January low also appears to be impulsive, which itself could also be part of a larger bear-flag breakout.
The daily chart shows a smaller bear flag and that bearish momentum is trying to roll over. I don’t like the lower tail on Monday’s candle, so open to a false move higher before the real move begins. But ideally looking for prices to hold beneath the 0.90345 high.
But due to the bearish clues on the weekly timeframe, the my bias remains bearish below 91c and for prices to head for the January low. But bears could focus on the weekly VPOC at 0.8886 for a more conservative downside target.

Economic events in focus (AEDT)
As outlined in multiple articles and videos, I don’t expect the RBA will cut rates today. It’s also debatable as to whether they will tinker with the statement too much ahead of the election and quarterly inflation figures, but if there is to be a change of tone then the statement and press conference are the places to find clues.
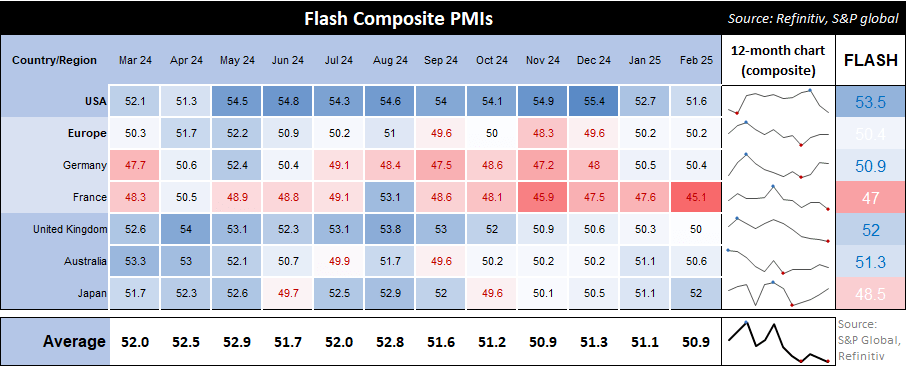
Final PMIs are released for the US, Europe, UK, Japan and Australia. The flash composite PMIs ticked marginally higher in March according to the flash report, so any major revisions could stir things up. Particularly if Japan’s PMIs are raised (to appease BOJ hawks) and the US PMIs are revised lower (to appease Fed doves).
- 09:00 – Australian manufacturing PMI (final)
- 10:30 – Japanese, Jobs/Applicants Ratio
- 10:50 - Tankan Quarterly Business Survey
- 11:30 – Australian Retail Sales (Feb)
- 12:45 – RBA Interest Rate Decision (no change expected)
- 15:30 – RBA Press Conference
- 17:30 – Swiss Retail Sales
- 19:30 – UK Manufacturing PMI (final)
- 20:00 – EU Core CPI, Unemployment Rate
- 23:30 – ECB President Lagarde Speaks
- 00:00 – FOMC Member Barkin Speaks
- 00:30 – Canadian Manufacturing PMI (Final)
- 00:45 – US Manufacturing PMI (Final)
- 01:00 – US ISM Manufacturing, JOLTS Job Openings
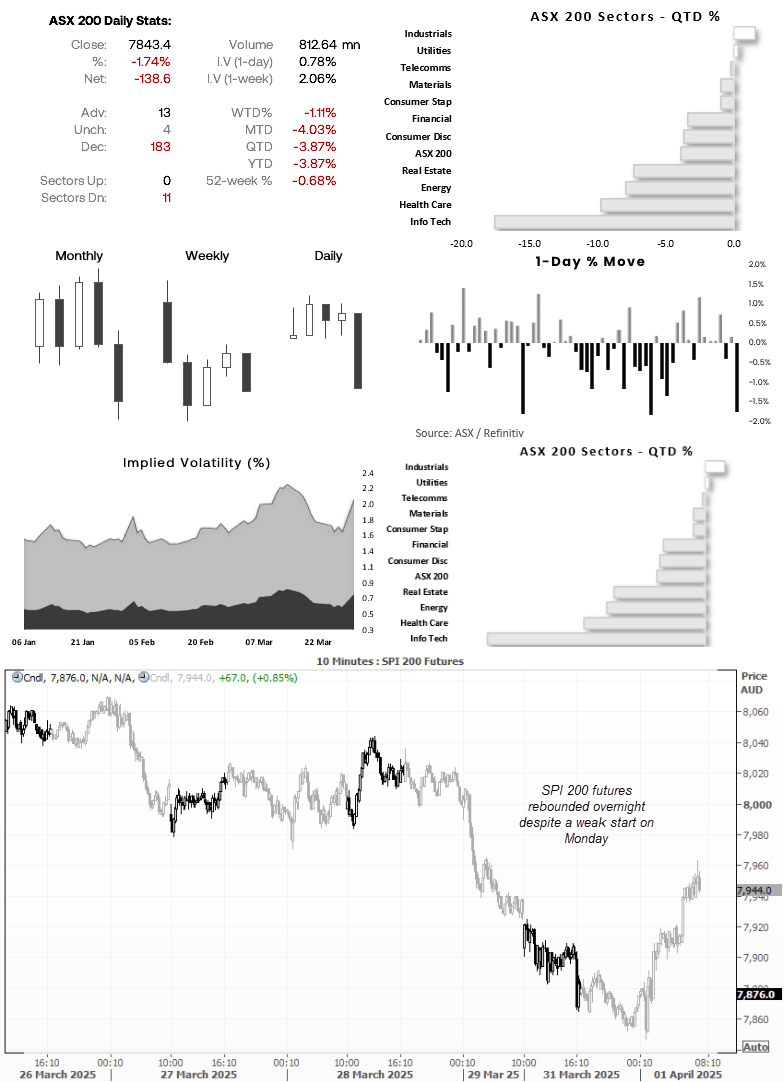
ASX 200 at a glance
- It was the worst day for the ASX 200 in three weeks, with all 11 sectors declining (led by materials and energy)
- Only 13 ASX stocks advanced on Monday, while 183 declined and 4 remained unchanged
- 1-day and 1-week implied volatility has spiked higher for the ASX 200
- This volatile end to the quarter has seen 9 of the 11 ASX 200 sectors decline in the first quarter, led by info tech and healthcare
-- Written by Matt Simpson
Follow Matt on Twitter @cLeverEdge
Latest market news
September 18, 2025 02:48 PM
June 23, 2025 01:22 PM
June 23, 2025 10:39 AM
June 20, 2025 05:23 PM
June 20, 2025 04:46 PM
June 20, 2025 03:35 PM

June 20, 2025 04:46 PM

June 20, 2025 03:35 PM

June 20, 2025 02:18 PM

June 20, 2025 12:21 PM