- Trimmed mean inflation increased to 2.8% y/y in April (2.7% prior)
- CPI excluding volatile items and travel also increased to 2.8%
- Weighted mean CPI rose 2.4% y/y for the third consecutive month (2.3% expected)
- Overall, headline inflation remains within the RBA’s 2-3% target band

Australia’s inflation rate crept higher in April, according to the latest CPI figures from the Australian Bureau of Statistics (ABS). Trimmed mean CPI — the Reserve Bank of Australia’s (RBA) preferred measure — rose to 2.8% y/y from 2.7% prior. CPI excluding volatile items and travel also rose, while weighted mean remained at 2.4% y/y for a third month.
View related analysis:
- AUD/USD Weekly Outlook: CPI, RBNZ, PCE - Key Data Ahead
- Nasdaq 100 Leads Wall Street Higher on Consumer Sentiment Rebound
- USD/JPY Outlook: US Dollar Rises on Trade News, Yen Ignores Hawkish BOJ
Reserve Bank of Australia (RBA) Expected to Cut in July
With money markets pricing in around an 80% chance of an RBA cut in July ahead of the data, I doubt the odds have fallen much with this slight uptick in inflation. It seems markets agree, given the Australian dollar is down around 20 pips after the release. Unless we see a notable uptick, traders are more focused on the fact that inflation remains within the RBA’s 2–3% target band.
Besides, the RBA next meet on July 8, which means they’ll have another monthly inflation report alongside employment data beforehand.
Australian Dollar Traders Lower Post-CPI
- AUD/USD: -0.3%
- AUD/CAD: -0.2%
- AUD/NZD: -0.1%
- AUD/JPY: -0.2%
- AUD/GBP: -0.2%
- AUD/EUR: -0.2%
- AUD/CHF: -0.2%
Australian Dollar (AUD) Technical Outlook:
AUD/USD Technical Analysis: Australian Dollar vs US Dollar
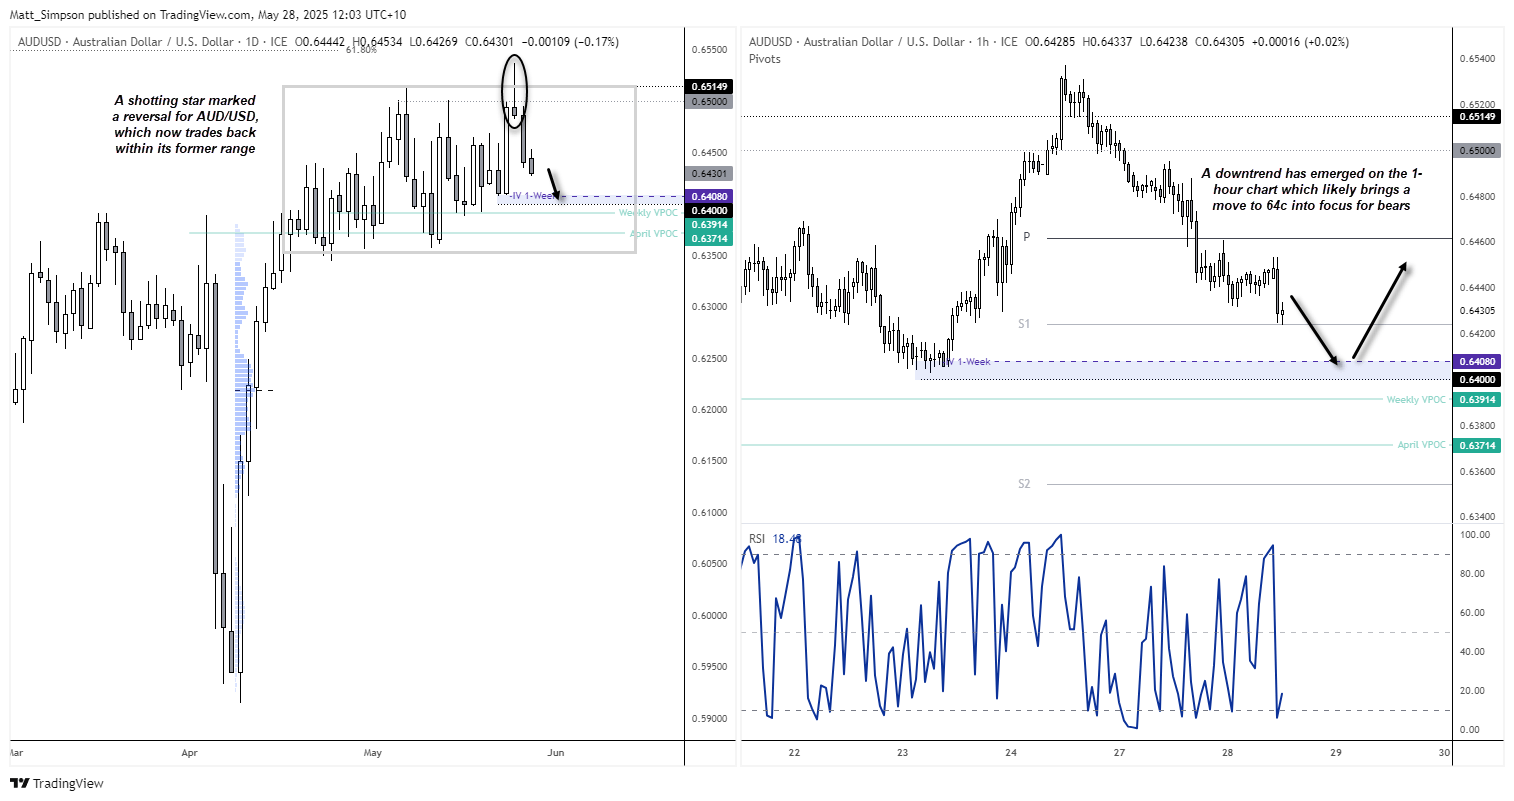
The Australian dollar rose to its highest level since late November on Monday, though its bullish breakout was short lived. News that President Trump had opted to delay his 50% tariffs on the European Union sparked a rebound for the US dollar, which resulted in a shooting star candle on AUD/USD by Monday’s close. That the 1-bar reversal was followed by a -0.7% loss on Tuesday has taken the shine off of last week’s strong close, even if AUD/USD remains above last week ‘s open (0.6410) for now.
A downtrend has emerged on the 1-hour chart and it looks like AUD?USD is now headed for 64c over the near term. Keep in mind this is near the lower 1-week implied volatility level using Friday’s close price. But if the US dollar extends is rally, then perhaps AUD/USD could be headed for 0.6350.

AUD/JPY Technical Analysis: Australian Dollar vs Japanese Yen
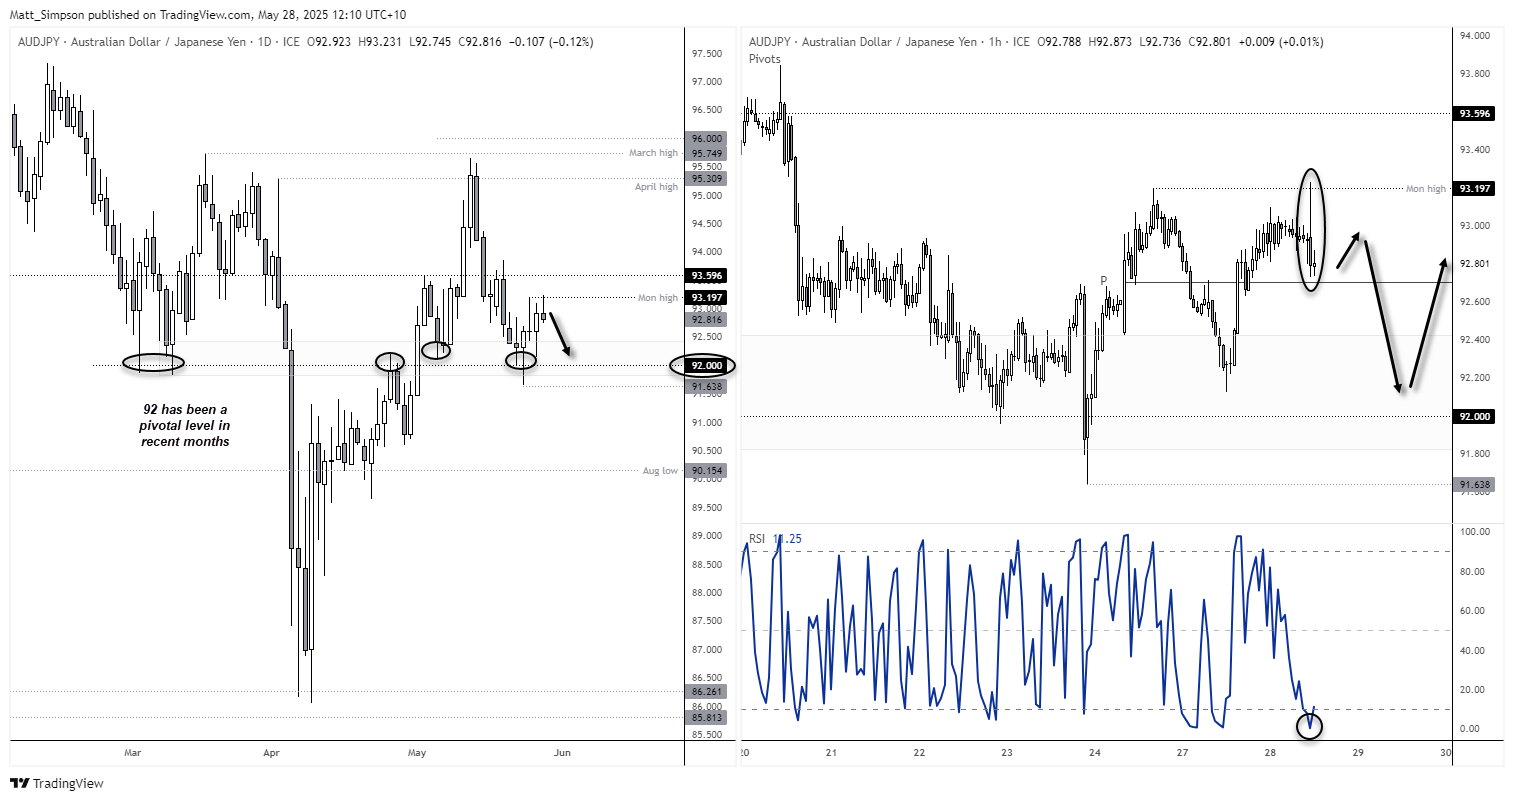
Prices have been grinding higher on the daily chart after AUD/JPY once again used the 92 handle as support. This may not be an ideal market for traders focussing on the daily candles, but it might provide opportunity for bears on the 1-hour chart over the near term.
A bearish outside candle formed on the AUD/JPY 1-hour chart following a false break of Monday’s high. A break beneath the weekly pivo point (92.70) opens up another run for 92. Keep in mind that the 1-hour RIS (2) is oversold, which suggests a minor bounce is on the cards. But bears could seek to fade into any such bounce within the bearish outside candle, and maintain a near-term bearish bias while prices remain above today’s high.

-- Written by Matt Simpson
Follow Matt on Twitter @cLeverEdge


