

Australian Dollar Technical Outlook: AUD/USD Short-term Trade Levels
- AUD/USD surges more than 9% off multi-year lows- rally stalls at downtrend resistance
- Australian Dollar near-term range breakout imminent– US Core PCE, NFPs on tap
- Resistance 6408/29, ~6465 (key), 6550– Support 6348/62, 6245/47 (key), 6170/88
The Australian Dollar is struggling to mount a fourth consecutive weekly advance with a rebound off downtrend support now testing trend resistance at the yearly high. A tight range has formed just below, and the immediate focus is on a breakout with the recent rally vulnerable while below the weekly high. Battlelines drawn on the Aussie short-term technical charts.
Review my latest Weekly Strategy Webinar for an in-depth breakdown of this AUD/USD technical setup and more. Join live on Monday’s at 8:30am EST.Australian Dollar Price Chart – AUD/USD Daily

Chart Prepared by Michael Boutros, Sr. Technical Strategist; AUD/USD on TradingView
Technical Outlook: The Australian Dollar staged an impressive V-shaped recovery month with AUD/USD surging more than 9% off multi-year lows. The advance has now extended into confluent resistance at 6408/29- a region defined by the 50% retracement of the 2024 decline and the February swing high. Note that the upper parallel of the descending pitchfork converges on this threshold over the next few days and further highlights the technical significance of this zone- looking for a reaction off this mark.
Australian Dollar Price Chart – AUD/USD 240min
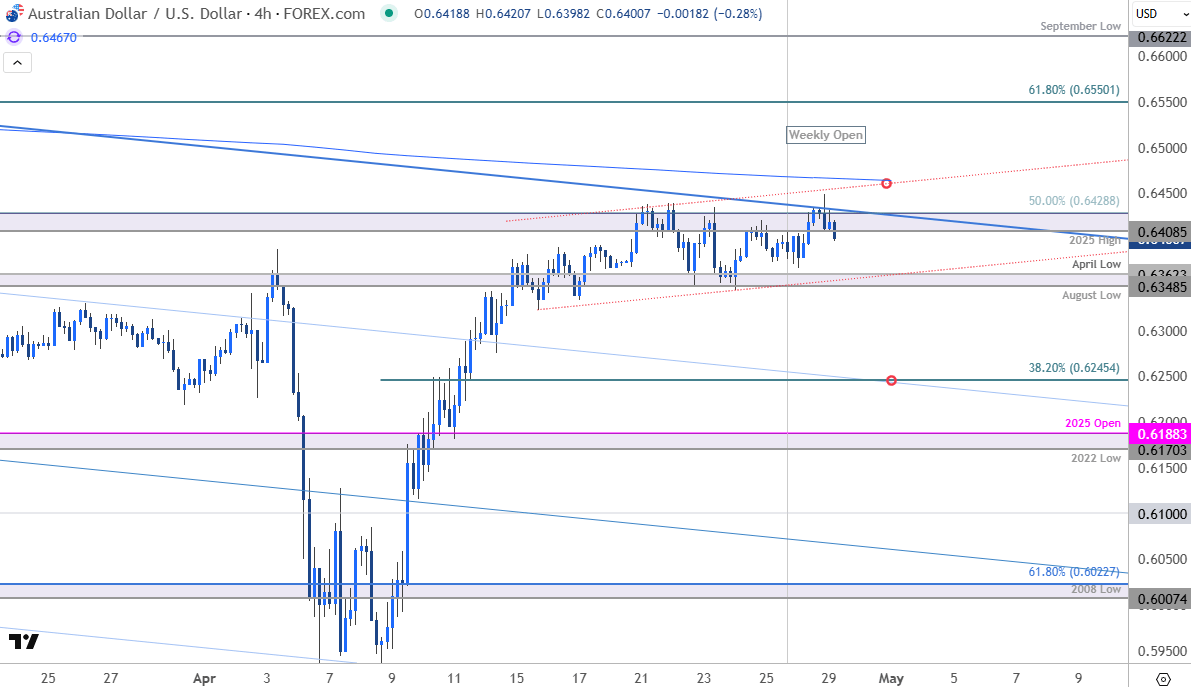
Chart Prepared by Michael Boutros, Sr. Technical Strategist; AUD/USD on TradingView
Notes: A closer look at Aussie price action shows AUD/USD trading within a well-defined range with last week’s opening-range still intact. Initial support rests with the August / April lows at 6348/62- a break / daily close below this threshold would threaten a larger setback towards the 38.2% retracement / monthly open at 6245/47 with key support steady at the 2022 low / 2025 yearly open at 6170/88 (an area of interest for possible downside exhaustion / price inflection IF reached). Losses below this threshold would mark resumption of the broader downtrend.
Ultimately, a topside breach / close above the 200-day moving average near ~6465 would be needed to validate a breakout of the October downtrend / suggest a larger trend reversal is underway. Subsequent resistance is eyed at the 61.8% retracement at 6550 and the November high-day close (HDC) at 6680.

Bottom line: A 9% rally off multi-year lows takes AUD/USD into multi-month downtrend resistance- risk for possible topside exhaustion / price inflection here. From a trading standpoint, a good zone to reduce portions of long-exposure / raise protective stops- losses should be limited to 6245 IF price is heading higher on this stretch with a close above the 200-day moving average need to fuel the next leg of the advance.
Keep in mind we get the release of key U.S. inflation tomorrow with Non-Farm Payrolls on tap into the monthly cross. Stay nimble into the releases and watch the weekly close here for guidance. Review my latest Australian Dollar Weekly Forecast for a closer look at the longer-term AUD/USD technical trade levels.
Key Economic Data Releases
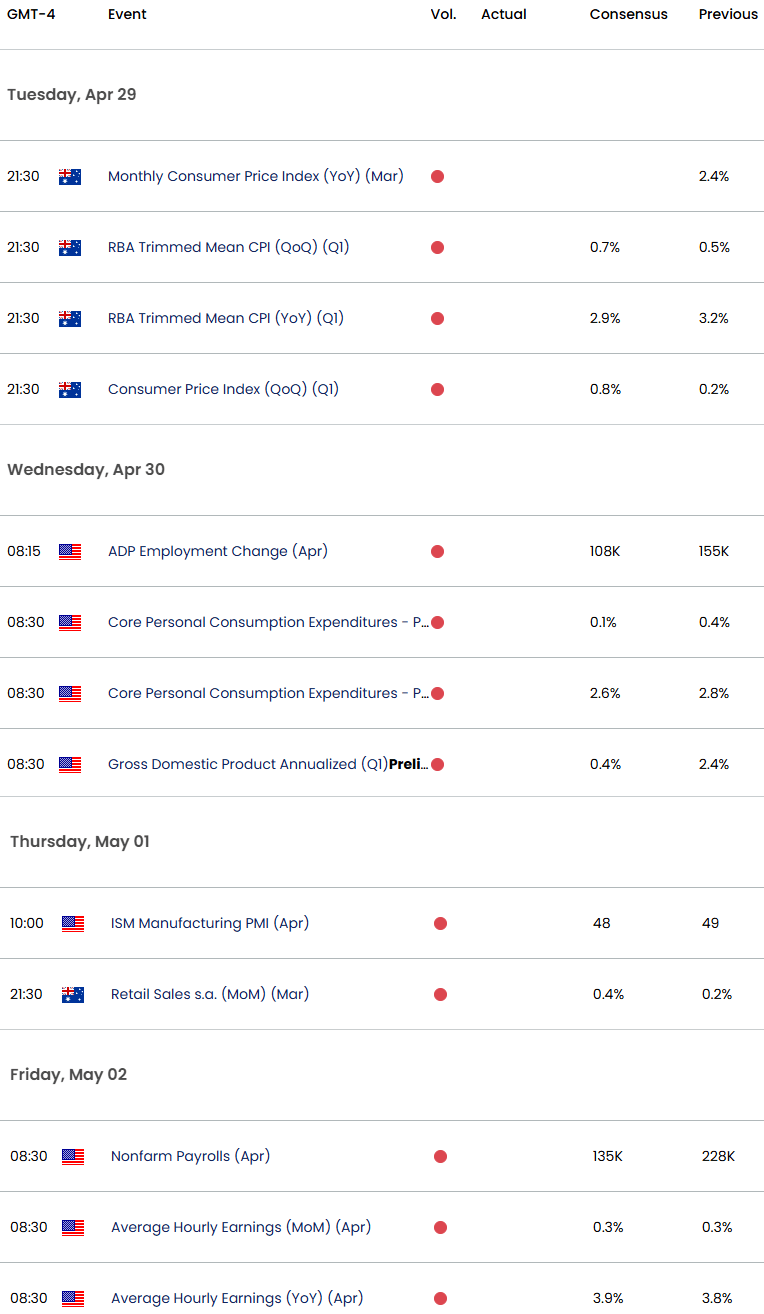
Economic Calendar - latest economic developments and upcoming event risk.
Active Short-term Technical Charts
Written by Michael Boutros, Sr Technical Strategist with FOREX.com
Follow Michael on X @MBForex
Latest market news
September 18, 2025 02:48 PM
June 23, 2025 01:22 PM
June 23, 2025 10:39 AM
June 20, 2025 05:23 PM
June 20, 2025 04:46 PM
June 20, 2025 03:35 PM

February 10, 2025 08:45 PM

February 1, 2025 02:00 AM

January 1, 2025 07:30 AM

December 23, 2024 02:45 PM