

Canadian Dollar Talking Points:
- USD/CAD snapped back as USD-strength showed after the FOMC rate decision on Wednesday.
- While USD/CAD trends remain bearish from both daily and weekly charts, the market had recently showed oversold conditions on the daily with a case of RSI divergence, illustrating that the sell-off had started to grow stale.
- The question now is whether sellers defend resistance at the key level of 1.4000, and for those looking to fade the rally in the USD, USD/CAD remains a compelling option for Dollar weakness.

The US Dollar is working on its third consecutive weekly gain and that’s a stark change of pace to the back-breaking downtrend that took over in March. Sellers hit the currency hard as recession fears built in the U.S. and this led to DXY going oversold on the weekly chart for only the third time in the past seven years. That’s a rare occurrence, as the indicator going into oversold territory requires a consistent and heavy one-sided push, the kind that can be difficult to continue as so much of the market has leaned one way for so long. It doesn’t mean that a low is definitely in-place though, as late-stage sellers can continue to jump on bounces and it’s not until demand, through a combination of profit taking and reversal trading, that the trend may begin to turn.
We’re at that stage with the US Dollar right now as the greenback is working on its third consecutive weekly gain for the first time in 2025. It’s still a shallow recovery, as only 23.6% of the 2025 sell-off has been clawed back and that retracement level is what has so far held the highs for this week in DXY.
But for those that are looking for USD weakness to continue, USD/CAD still makes for a compelling option with consideration of the longer-term range that remains in-effect for the pair. And for the shorter-term trend, there’s now a few spots of possible lower-high resistance that come into play.
The swing-high from last August has so far come in to hold this week’s high at 1.3947. Just above that, the 1.4000 area still looms large, and as I looked at back in early-April after the initial break, sellers have so far defended that with a lower-high at 1.3978, which helps to draw up a resistance zone around the big figure.
Ideally for bears, that’s the zone that will remain respected as tests above 1.4000 incentivize sellers to jump on the pullback. That would also be near the 23.6% Fibonacci retracement of the sell-off in the pair so if it doesn’t hold, it’s not like bears are done for.
The level above that is the 38.2% retracement of that same move, which is confluent with a prior spot of support at 1.4151, and I’ve synced that up to 1.4178 to create a resistance zone in the pair; and I’m considering that as an ‘r3’ zone of resistance for USD/CAD.
USD/CAD Weekly Price Chart
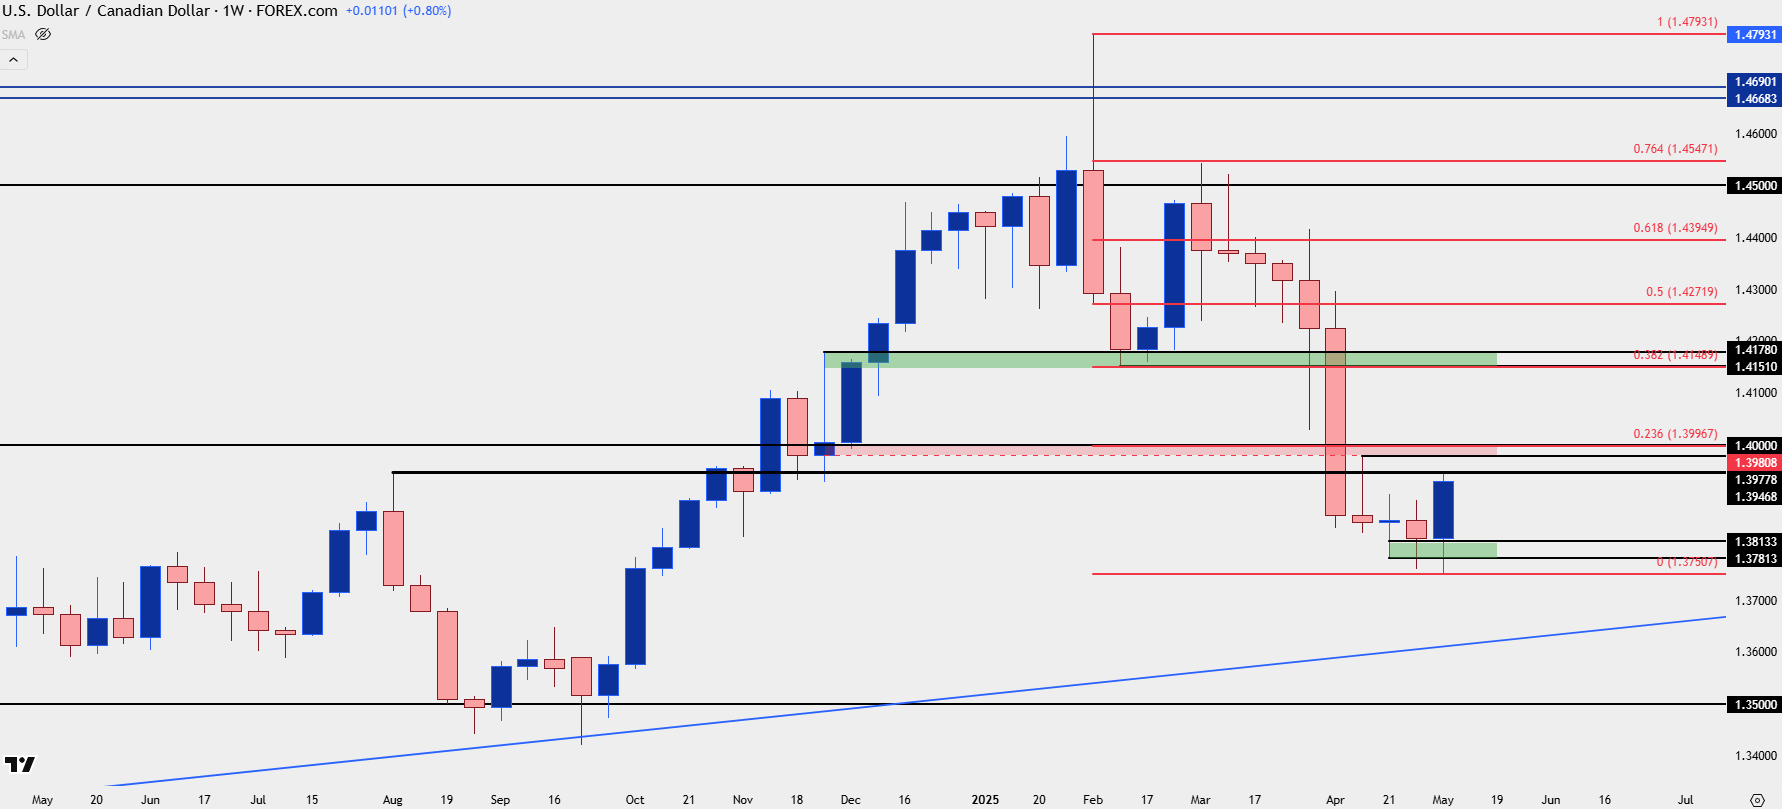 Chart prepared by James Stanley; data derived from Tradingview
USD/CAD: A Grinding Sell-Off
Bulls haven’t been able to show much life in USD/CAD until the Wednesday FOMC meeting, and that’s not necessarily a great thing for sellers. The pair pushed into oversold territory in April but given the slowing in the sell-off, the RSI indicator began to diverge, which can show ahead of pullback or reversal scenarios.
After all, most trends take time to turn and the start of a bullish reversal will often begin with sellers pushing less and less at fresh lows. That can form a falling wedge formation as sellers continue to punch at resistance or tests of highs but grow more and more reticent upon tests of support or at lows.
In USD/CAD from the daily chart, it appears to be profit taking from shorts that helped to bring the Thursday breakout, which has so far run into Friday. This illustrates a clear push for control on shorter time frames in USD/CAD, but as noted above, the bigger question is whether sellers are incentivized to jump in on tests around the 1.4000 level or perhaps even the 1.4150 area.
USD/CAD Daily Chart
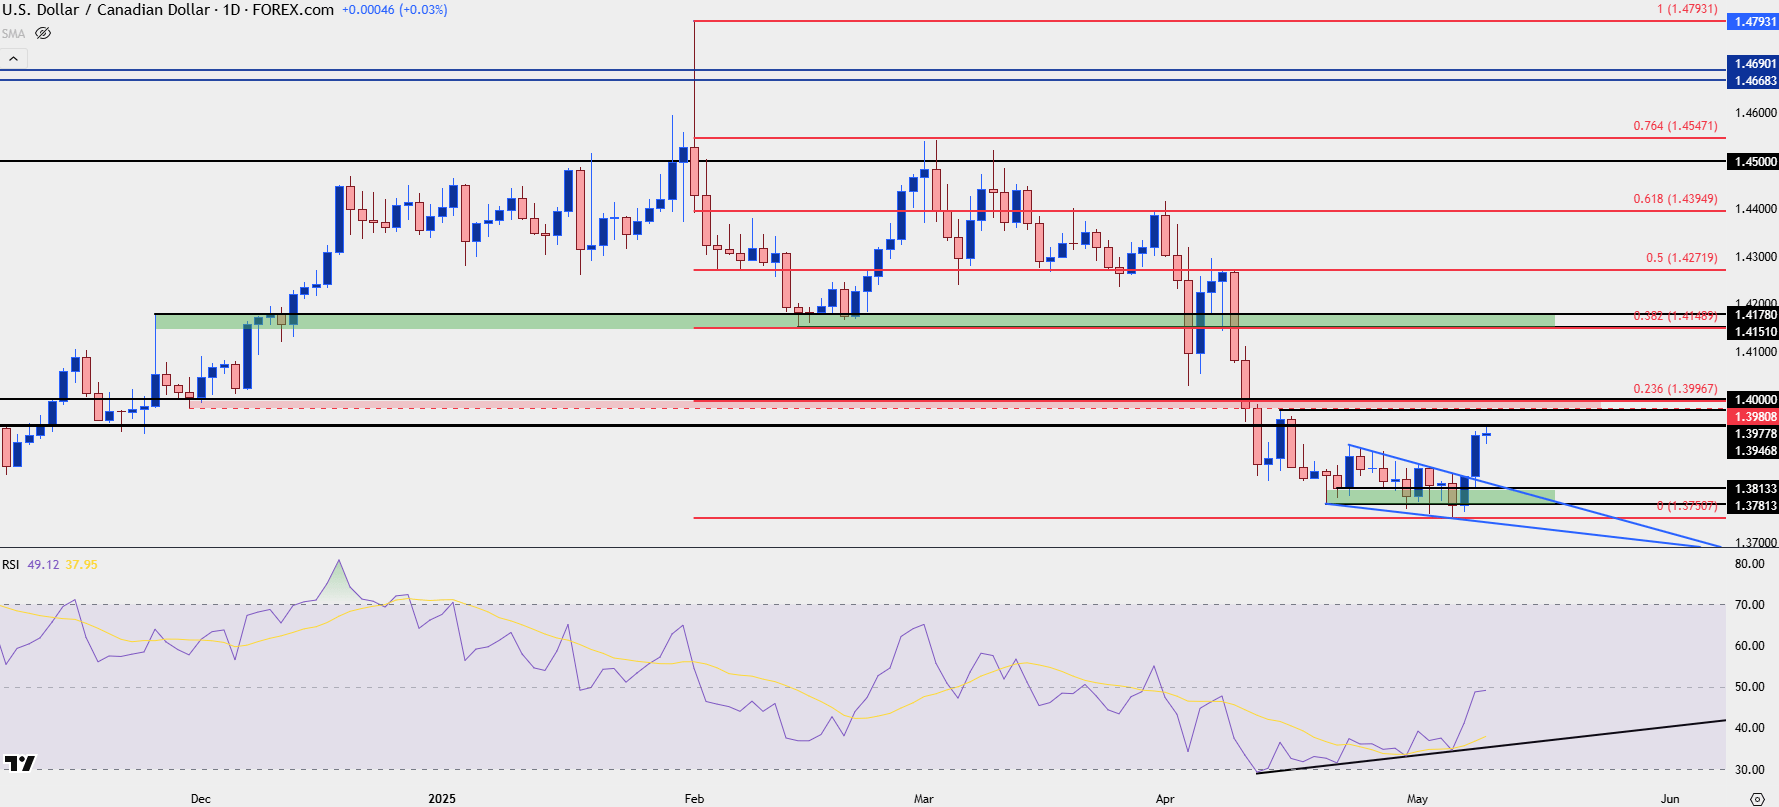 Chart prepared by James Stanley; data derived from Tradingview
USD/CAD: The Big Picture
In USD/CAD, it’s the longer-term backdrop that remains so appealing from the short side. The pair has been range-bound for almost a full decade now and the false breakout in February held within that context. It took some time for sellers to take over, as the March sell-off in DXY wasn’t enough to produce a lower-low in USD/CAD. But in April, bears made their mark by pushing the pair back below the vaulted 1.4000 level.
Bulls weren’t able to show much life until this week, with the push after the FOMC rate decision; and this is why that 1.4000 level remains so important, along with the 1.4178 level as a deeper spot of resistance potential.
The challenge to this backdrop at the moment is longer-term juxtaposition against the U.S. Dollar, which has held a major spot of long-term support while remaining near big picture lows in DXY. It’s possible for USD/CAD to sell-off even with DXY continuing to bounce as the larger components of the DXY basket are the Euro, Japanese Yen and British Pound. The Canadian Dollar is a mere 9.1% clip of DXY, so we can have episodes such as March when DXY tanks but USD/CAD holds up relatively well. In this scenario, however, the Canadian Dollar would need to remain as stronger than the U.S. Dollar if the USD/CAD pair is going to go against the grain of a wider USD reversal scenario.
But, if we do see USD bears continue to push, USD/CAD remains as one of the more attractive venues given this backdrop. And as the old saying goes, ‘the chart is the chart,’ and this presents those spots of lower-high resistance potential to work with intermediate-term trends in the context of this longer-term range.
USD/CAD Monthly Price Chart
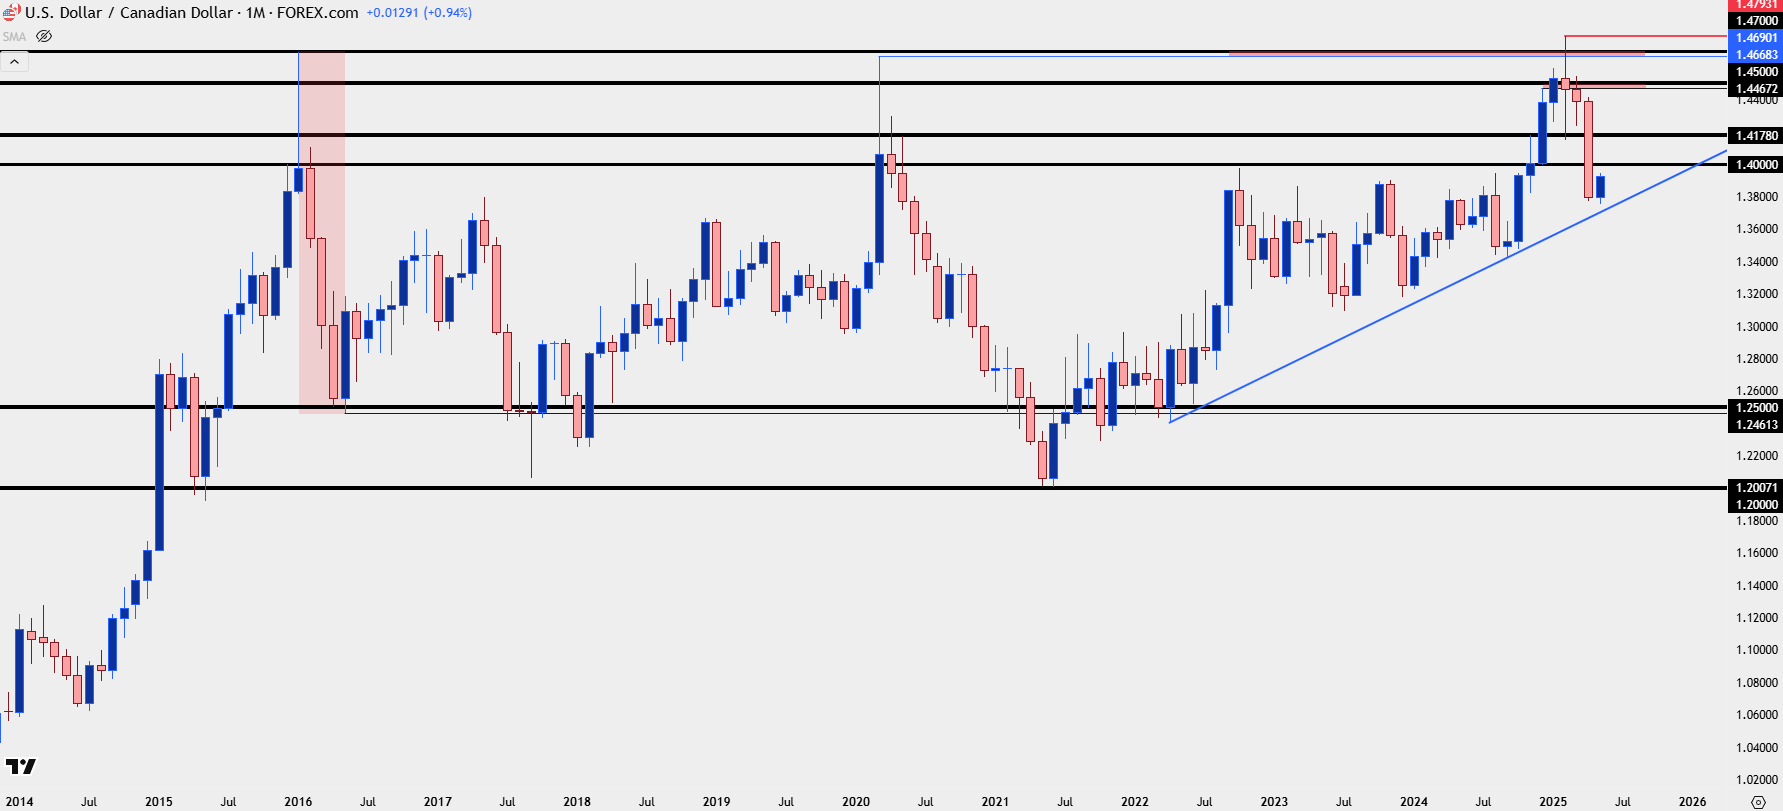
Chart prepared by James Stanley; data derived from Tradingview
--- written by James Stanley, Senior Strategist
Latest market news
September 18, 2025 02:48 PM
June 23, 2025 01:22 PM
June 23, 2025 10:39 AM
June 20, 2025 05:23 PM
June 20, 2025 04:46 PM
June 20, 2025 02:18 PM

June 19, 2025 09:09 AM

June 18, 2025 02:55 PM

June 18, 2025 08:19 AM

June 18, 2025 02:21 AM