

Canadian Dollar, USD/CAD Talking Points:
- The USD/CAD bearish trend extended this week with some help from the Bank of Canada on Wednesday. The move has started to take on a grinding appearance, however, and positioning seems very one-sided in the pair following the 1,000+ pip pullback over the past four months.
- USD/CAD remains attractive for USD-weakness scenariosv as I’ve been discussing in webinars and articles, but the larger question is whether the USD sell-off is overdone as bears haven’t been able to make progress below the April swing low, even with CAD-strength continuing to push fresh lows in the USD/CAD pair.
- If we do get a USD pullback, it can be a prime environment to look for lower-highs in USD/CAD, so that if we do see bears resuming the Dollar trend, similar to the May pullback, continuation scenarios can remain front-and-center.

USD/CAD has continued to push down for a fresh 2025 low as seen on Thursday. This time there was a bit of push from the Bank of Canada rate decision on Wednesday but like what I had looked at last week, sellers in the pair haven’t been able to show much stretch on those tests of fresh lows.
There has been some notable divergence, however: The US Dollar has so far held a higher low as buyers defended the April swing low but USD/CAD has continued to push lower, even if in a grinding, almost begrudging fashion. This highlights additional Canadian Dollar strength but it makes for a difficult environment to chase the move-lower, as there’s now both the case of diverging RSI on the daily chart, as well as a falling wedge formation that saw support defended this week.
USD/CAD Daily Price Chart

Chart prepared by James Stanley; data derived from Tradingview
USD/CAD Intermediate-Term
Longer-term, bearish trends remain attractive in my opinion as there’s still the decade-long range that remains in-play. And so far in 2025, sellers have put in some work to first reverse a massive bullish breakout in early-February, and then to push the pair back below the 1.4000 handle.
And that big figure even did a great job of holding resistance in early-May, as the USD was rallying from its own oversold conditions that showed in April. It’s what’s happened since that’s kept USD/CAD as one of the more attractive venues for USD weakness to continue but on that same note, it’s also increasingly difficult to chase the pair lower as that short-side move has started to grind in late-May and now early-June.
From the weekly chart below we can see both price trading below a major spot of confluent support, and the longer-term range that remains of attraction for big picture themes.
At this stage, I’m in a similar spot as I was in late-April, where I’d like to see a pullback with a show of seller defense at a spot of lower-high resistance, keeping the door open for bearish continuation but allowing for some pullback for positioning to reset a bit. Because when a move remains one-sided, and more and more sellers have already jumped on the trend, there’s fewer on the sidelines that can jump on to drive the trend to fresh lows. And there’s also more shorts holding which means potential for a short squeeze type of scenario.
USD/CAD Weekly Price Chart
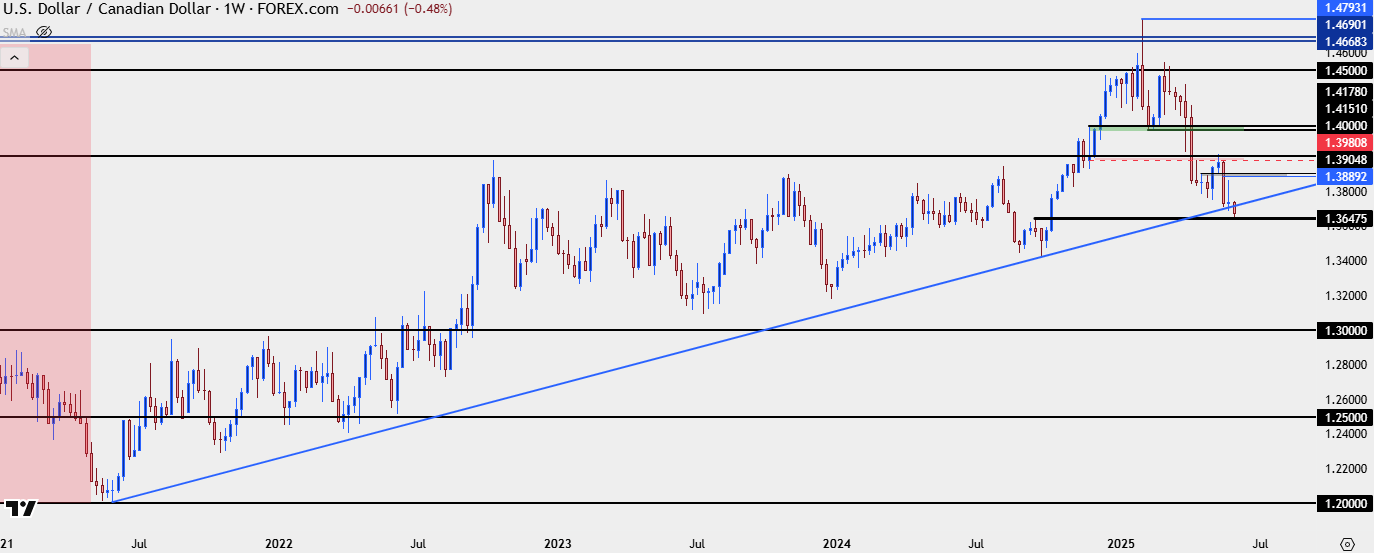 Chart prepared by James Stanley; data derived from Tradingview
USD/CAD Shorter-Term Strategy
On the four-hour chart below those bearish breakouts become more noticeable, particularly with how much less sellers have been able to stretch the move on each subsequent low. With 1.3648 showing up as support we’ve started to see bulls push a bit more, but there still wouldn’t be a higher-high on this four-hour chart with which to scope out counter-trend or larger pullback themes.
For possible resistance, I think that the first significant test would be around the 1.3750 level, which was the swing-low in early-May before we got the 1.4000 test. On Tuesday, it looked like prices might bounce up to that level but sellers came in early to defend the move, holding the highs at 1.3743, which currently constitutes the most recent lower-high on the four-hour chart. Collectively those prices make for an ‘r1’ zone of resistance potential.
Bulls forcing a break above that would be a big deal, in my opinion, and if we’re seeing that I would also anticipate USD-strength in EUR/USD and USD/JPY, with the former as a more attractive venue for working with that theme. The next resistance zone overhead is the same that was resistance in April and then support-turned-resistance in May, plotting from 1.3890-1.3905. And then above that, which I’m qualifying as the ‘r3’ zone for now, the 1.4000 handle that ultimately held the highs on the May pullback.
If bulls force a break above that, which I would signify with a daily closed body going through the 1.4000 level, then we’re likely looking at broader USD-strength themes. And then I would cast the look for resistance in the pair up to the 1.4150-1.4178 zone.
USD/CAD Four-Hour Price Chart
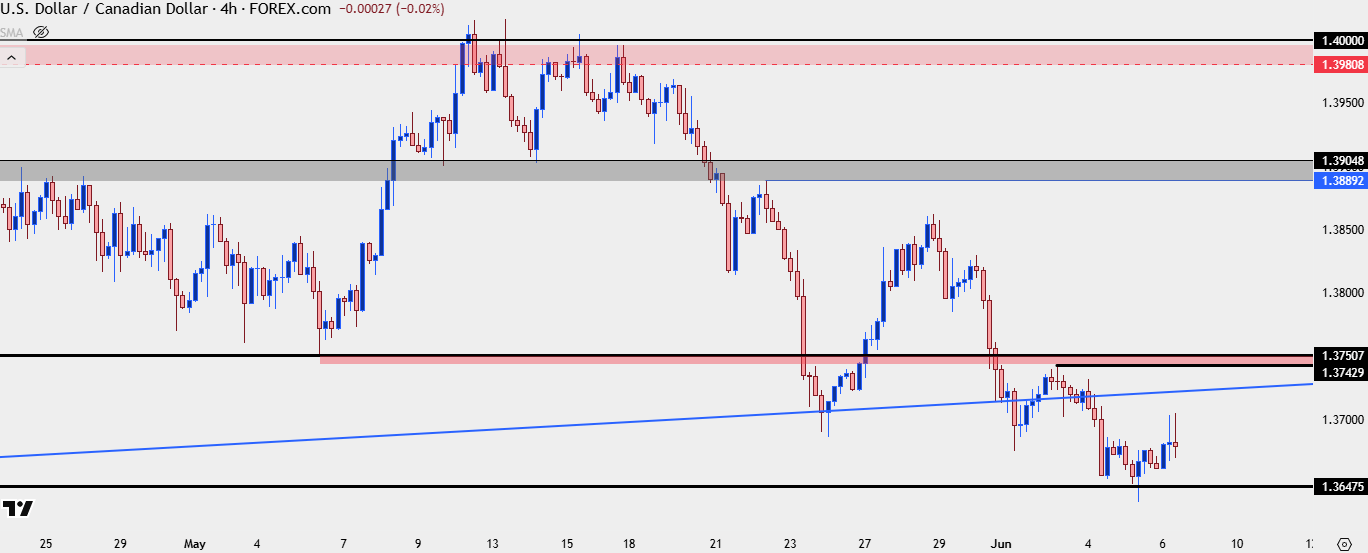 Chart prepared by James Stanley; data derived from Tradingview
--- written by James Stanley, Senior Strategist
Latest market news
June 23, 2025 01:22 PM
June 23, 2025 10:39 AM
June 20, 2025 05:23 PM
June 20, 2025 04:46 PM
June 20, 2025 03:35 PM
June 20, 2025 02:18 PM

June 6, 2025 03:20 PM

May 30, 2025 06:17 PM
May 23, 2025 02:42 PM

May 19, 2025 03:15 PM