

After falling to the $65 per barrel zone, WTI has posted a recovery of over 6% over the past two weeks of trading. For now, the bias remains neutral, as the market stays focused on the potential outcomes of U.S. trade tariffs, which have recently brought uncertainty even to the commodities market in the short term.

Tariff Pressures Intensify
Crude oil has also been impacted by recent tariff threats issued by President Donald Trump against various countries, contributing to a sustained upward pressure on WTI in most recent sessions.
The first warning was directed at countries engaging in oil trade with Venezuela, following an announcement by former President Donald Trump regarding the possible imposition of 25% sanctions on nations that continue to purchase Venezuelan crude oil. As part of this measure, the U.S. also moved to revoke international licenses held by companies such as Repsol, effectively restricting their ability to operate within Venezuela’s oil sector.
Furthermore, Trump has mentioned that similar measures could be applied to Russia, citing a lack of commitment to a ceasefire in Ukraine. A tariff ranging from 25% to 50% is being considered for countries buying Russian oil in the near term.
These potential sanctions on two major oil producers could significantly disrupt the global supply balance. According to recent data, Venezuela's daily output exceeds one million barrels (February 2025), while Russia’s production is at 9.7 million barrels per day (November 2024). If the White House moves forward with these tariffs, a notable supply reduction could follow. Given that demand remains stable for now, this scenario could serve as a bullish catalyst for WTI prices.
How Is Market Confidence Holding Up?
The OVX (Cboe Crude Oil Volatility Index), which measures expected 30-day volatility in oil prices, remains below the 30 level, showing a sideways movement in recent sessions.
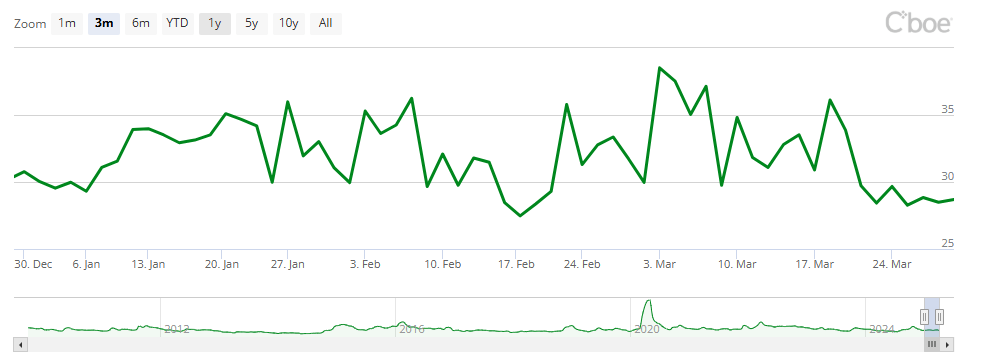
Source: CBOE
A sustained decline in the OVX suggests that the market anticipates greater stability in oil prices. Volatility levels have remained relatively low compared to the past three months, indicating that amid global uncertainty, investors have opted for a more stable positioning in this market.
If the OVX remains at or below 30, market confidence in oil could stabilize, supporting a short-term bullish bias in WTI. However, if the index climbs above 40 again, the selling pressure seen in early March could resurface.
WTI Technical Outlook
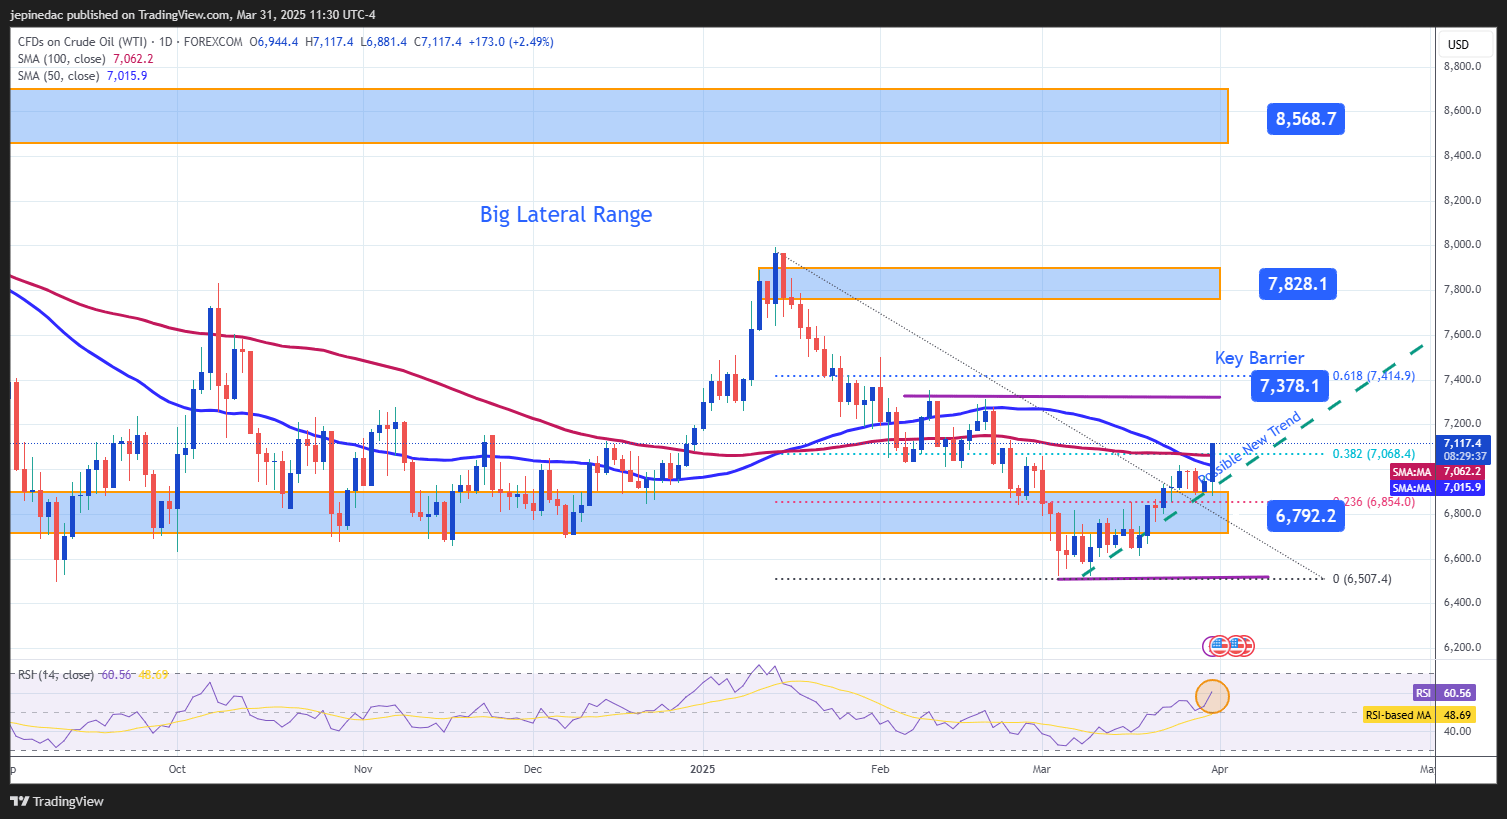
Source: StoneX, Tradingview
- Wide Sideways Channel: WTI continues to trade within a lateral channel, with $85 as resistance and $67 as support. This pattern has held firm for several months, with the support level once again halting recent bearish momentum. For now, this channel remains the most relevant technical formation, as the price has yet to achieve a decisive breakout.
- Potential New Trend: Recent bullish price action has begun to trace a potential uptrend, which currently faces resistance around the 50- and 100-period moving averages. If buying pressure persists, this new trendline could become more significant in the short term.
- RSI: The Relative Strength Index has started to rise with a bullish slope, holding above the neutral 50 level in recent sessions. This indicates that the market's prevailing momentum has turned bullish. As long as the RSI stays below the overbought zone (70), there are no clear signs of an imminent correction.
Key Levels:
- $73 – Key resistance: This level matches previous weekly highs and aligns with the 61.8% Fibonacci retracement, reinforcing its technical significance. A sustained breakout could pave the way for a stronger bullish trend over the medium term.
- $78 – Distant resistance: This remains the highest price reached in 2025. A move toward this level could solidify a more prolonged bullish phase in the coming months.
- $67 – Key support: This level marks the bottom of the lateral channel. A breakdown below it could cause the structure to collapse, triggering strong selling pressure and invalidating the tentative bullish trendline.
Written by Julian Pineda, CFA – Market Analyst
Latest market news
Today 09:49 AM
Yesterday 08:00 PM
Yesterday 02:00 PM
Yesterday 08:00 AM

April 30, 2025 12:48 PM

April 28, 2025 04:11 PM

April 28, 2025 02:00 PM

April 25, 2025 02:00 PM