

WTI crude has dropped more than 18% over the past seven trading sessions, and the strong bearish bias has remained intact. This decline has been driven by growing concerns around the ongoing trade war, which has weighed on global economic growth expectations and, in turn, kept oil demand projections suppressed. As the trade conflict escalates, downward pressure on WTI is likely to remain dominant in the sessions ahead.

Demand Outlook Weakens
The new trade war has played a central role in recent movements in oil prices. In recent days, it was confirmed that the United States imposed a 145% tariff on all goods imported from China, effective immediately. In response, China announced a 125% tariff on U.S. goods, scheduled to take effect in the coming days. Furthermore, the Chinese government stated that it will disregard any future threats from the White House.
This escalation marks a major turning point in the trade conflict, as two of the world’s largest economies are actively seeking to disrupt each other’s economic activity. This situation not only affects the U.S. and China, but also clouds the global economic growth outlook, which is heavily tied to the performance of both nations.
According to the latest 2023 data, the U.S. and China remain the world’s two largest oil consumers, with daily demand of 18.98 million and 16.57 million barrels, respectively.
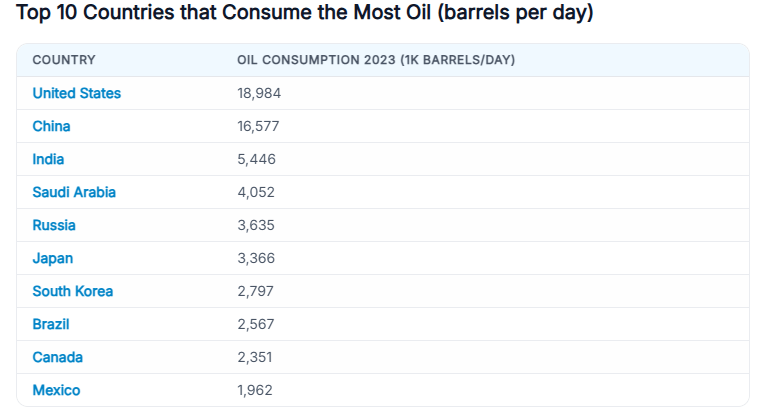
Source: Worldpopulationreview
In this scenario, a decline in economic activity in both countries—driven by tariffs—could significantly impact global oil demand. Reduced economic output generally translates into lower consumption of raw materials, particularly oil. Reflecting this, the International Energy Agency (IEA) has already lowered its global demand growth forecast for the year, from 1.2 million to 900,000 barrels per day. This revision has been a key factor behind the sharp decline in oil market confidence during recent sessions.
On the supply side, OPEC+ has started to implement its plan to increase production. In early April, the organization announced an upcoming production increase of 411,000 barrels per day, starting in May, citing the need to ease restrictions after several years of limited output among member nations.
As a result, the market faces a dual headwind: weakening global demand, due to the economic slowdown in the U.S. and China, and rising supply driven by OPEC+ decisions. This combination could reinforce the bearish outlook for oil prices in the short term.
WTI Technical Outlook
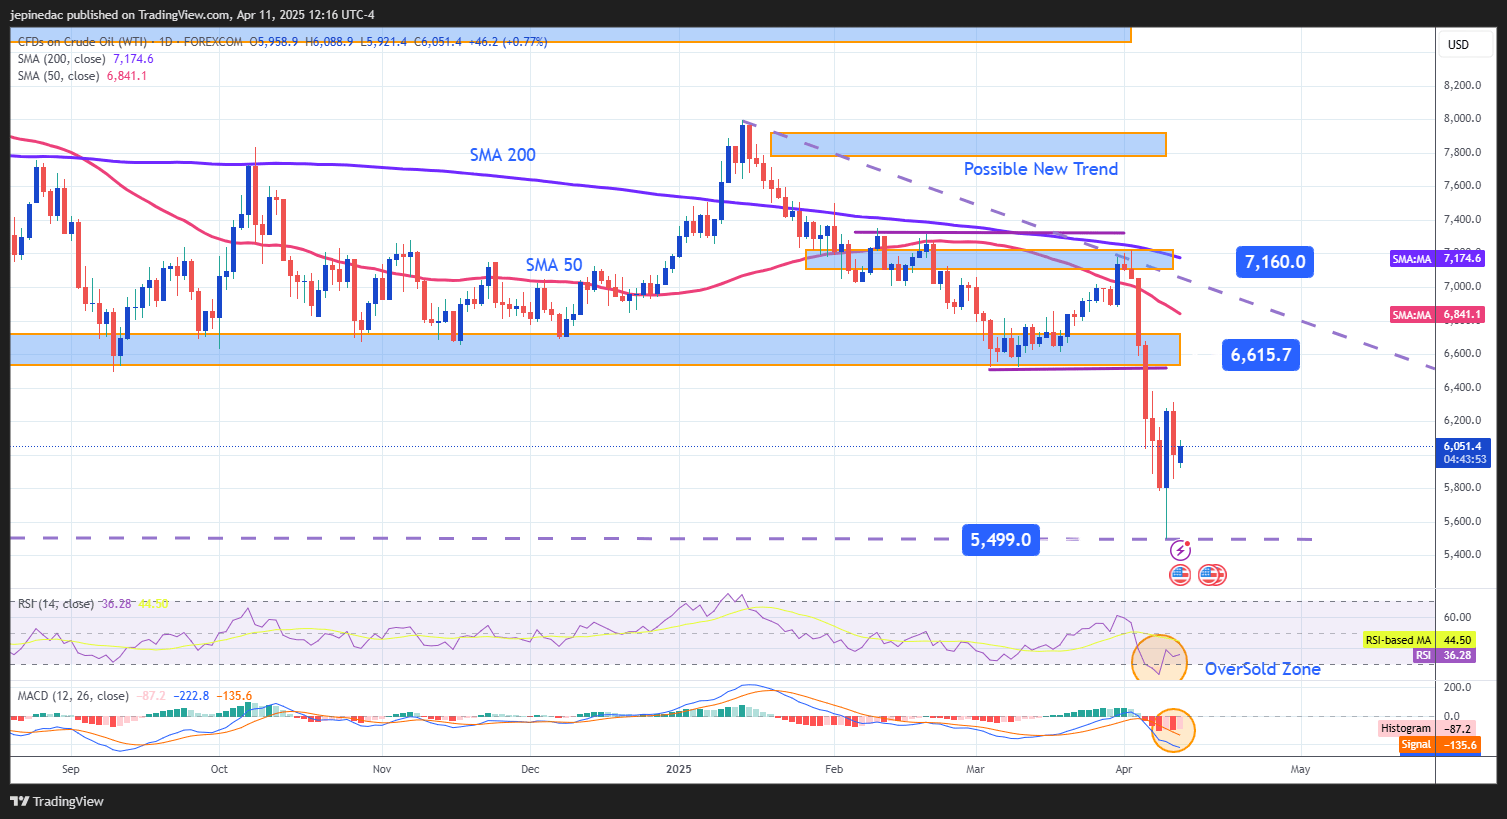
Source: StoneX, Tradingview
- Emerging Downtrend: Recent bearish swings have started to form a new descending trendline, beginning in mid-January. Currently, selling pressure has brought prices down to $60 per barrel zone. However, due to the speed of the recent drop, the market could experience short-term corrective rebounds. For now, this new bearish trend remains the most relevant formation to monitor.
- RSI: The RSI line continues to reflect bearish momentum, remaining below the neutral 50 level. However, the indicator is now approaching oversold territory, which may suggest an imbalance in market forces and open the door to technical rebounds in the coming sessions.
- MACD: The MACD line, its signal line, and the histogram all remain below the zero level, indicating that recent momentum is still bearish. As MACD continues to move lower, this may point to a further consolidation of selling pressure in the short term.
Key Levels:
- $55 – Critical Support: This level coincides with a zone of historical neutrality last seen in 2019. A clear break below it could trigger a deeper bearish trend.
- $66 – Near Resistance: Represents the consolidation zone from the previous broad lateral range. It may serve as a potential area for short-term bullish corrections.
- $71 – Major Resistance: Aligned with the 200-period simple moving average. A return to this level could pose a threat to the current bearish structure on the chart.
Written by Julian Pineda, CFA – Market Analyst
Latest market news
June 23, 2025 01:22 PM
June 23, 2025 10:39 AM
June 20, 2025 05:23 PM
June 20, 2025 04:46 PM
June 20, 2025 03:35 PM
June 20, 2025 02:18 PM

June 5, 2025 05:32 PM

May 30, 2025 04:45 PM

May 22, 2025 03:08 PM

May 20, 2025 04:48 PM