

View related analysis:
- Nasdaq 100 Forecast: Asset Managers Ramp Up Bearish Tech Bets
- EUR/USD forecast: Its pre-ECB surge did not come without a warning
- Bullish Bets on the Euro and Yen Continue to Rise: COT Report
- AUD/USD weekly outlook: 10 March 2025
I noted in recent weeks that the downtrend on WTI crude oil has lacked bearish enthusiasm from futures traders. Data from the weekly Commitment of Traders (COT) report shows that the combined volume of large speculators and managed funds have been trending lower alongside prices, which could be compared to driving down a hill while easing off the accelerator. A truly bearish move we see investors accelerate their way down that hill and volumes rise.
So, while large speculators reduced their net-long exposure for a seventh week, they have also trimmed longs six of those seven weeks, and reduced shorts two of the last three.
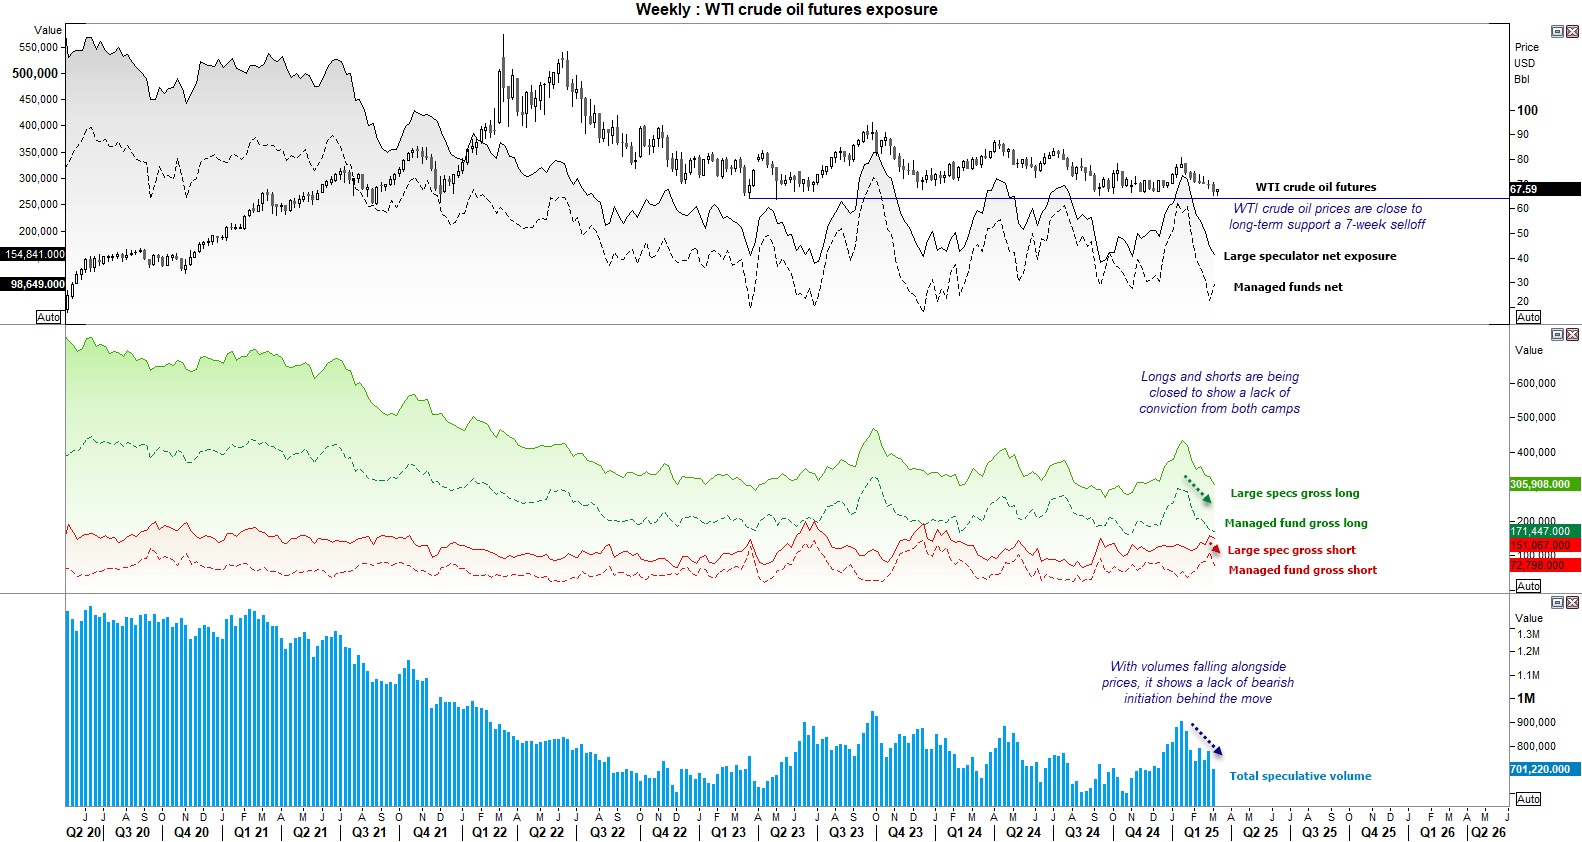
But more importantly. Managed funds closed shorts again crude oil at their fastest pace in six months last week, by culling 35.8k contracts. That they also trimmed longs by -5.9k contracts shows they’re not ready to turn this ship around, but its rally suggests the downside for oil could be limited from here.
Besides, prices are also approaching a series of historic lows set between 2021 and 2024, so at the very least we could find the bearish trend loses steam if it is to persist.

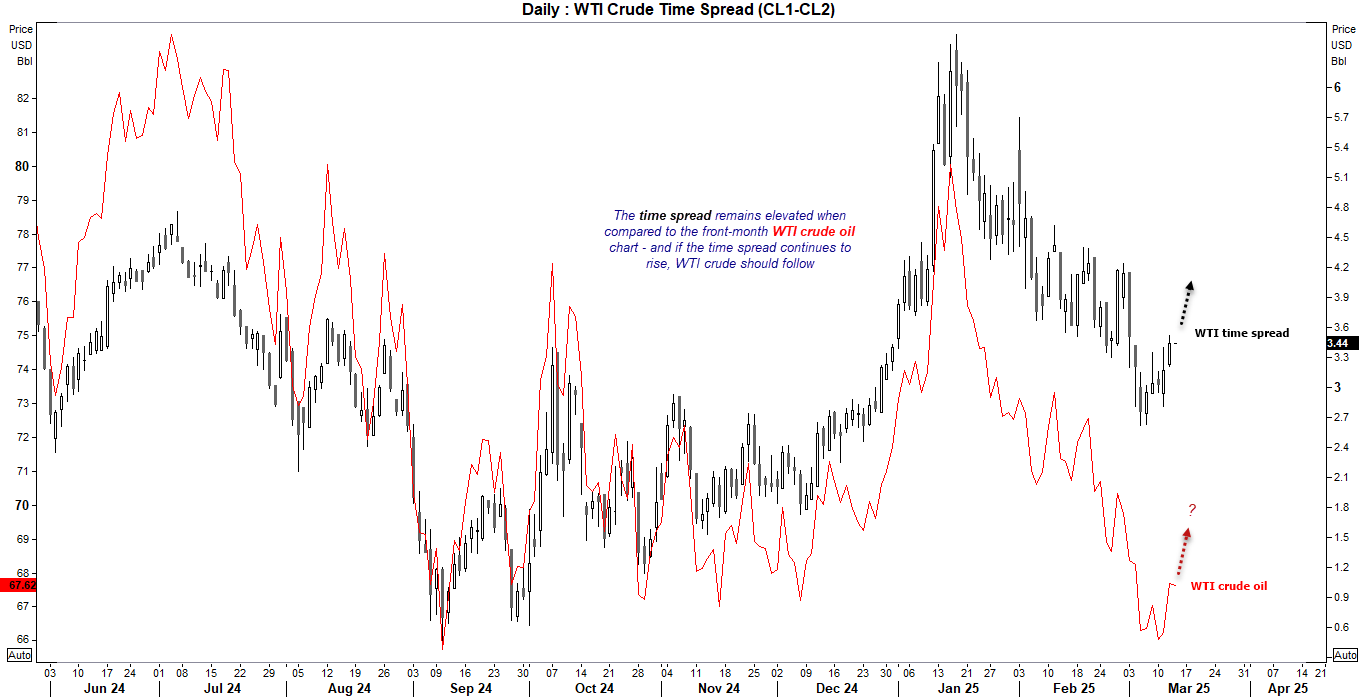
WTI Crude Oil vs Time Spread
This chart compared WTI crude oil to its own time spread, which in this case is the front-month mines the second month. If the time spread is rising (contango) it suggests expectations of higher oil prices, and if it is lower (backwardation) then expectations are for lower oil prices.
We can see that oil prices generally trend in the same direction as its own times spread, but in this case WTI crude oil time spread appears elevated compared to the WTI crude oil chart. And if the time spread continues to move higher, WTI crude oil prices should in theory follow.
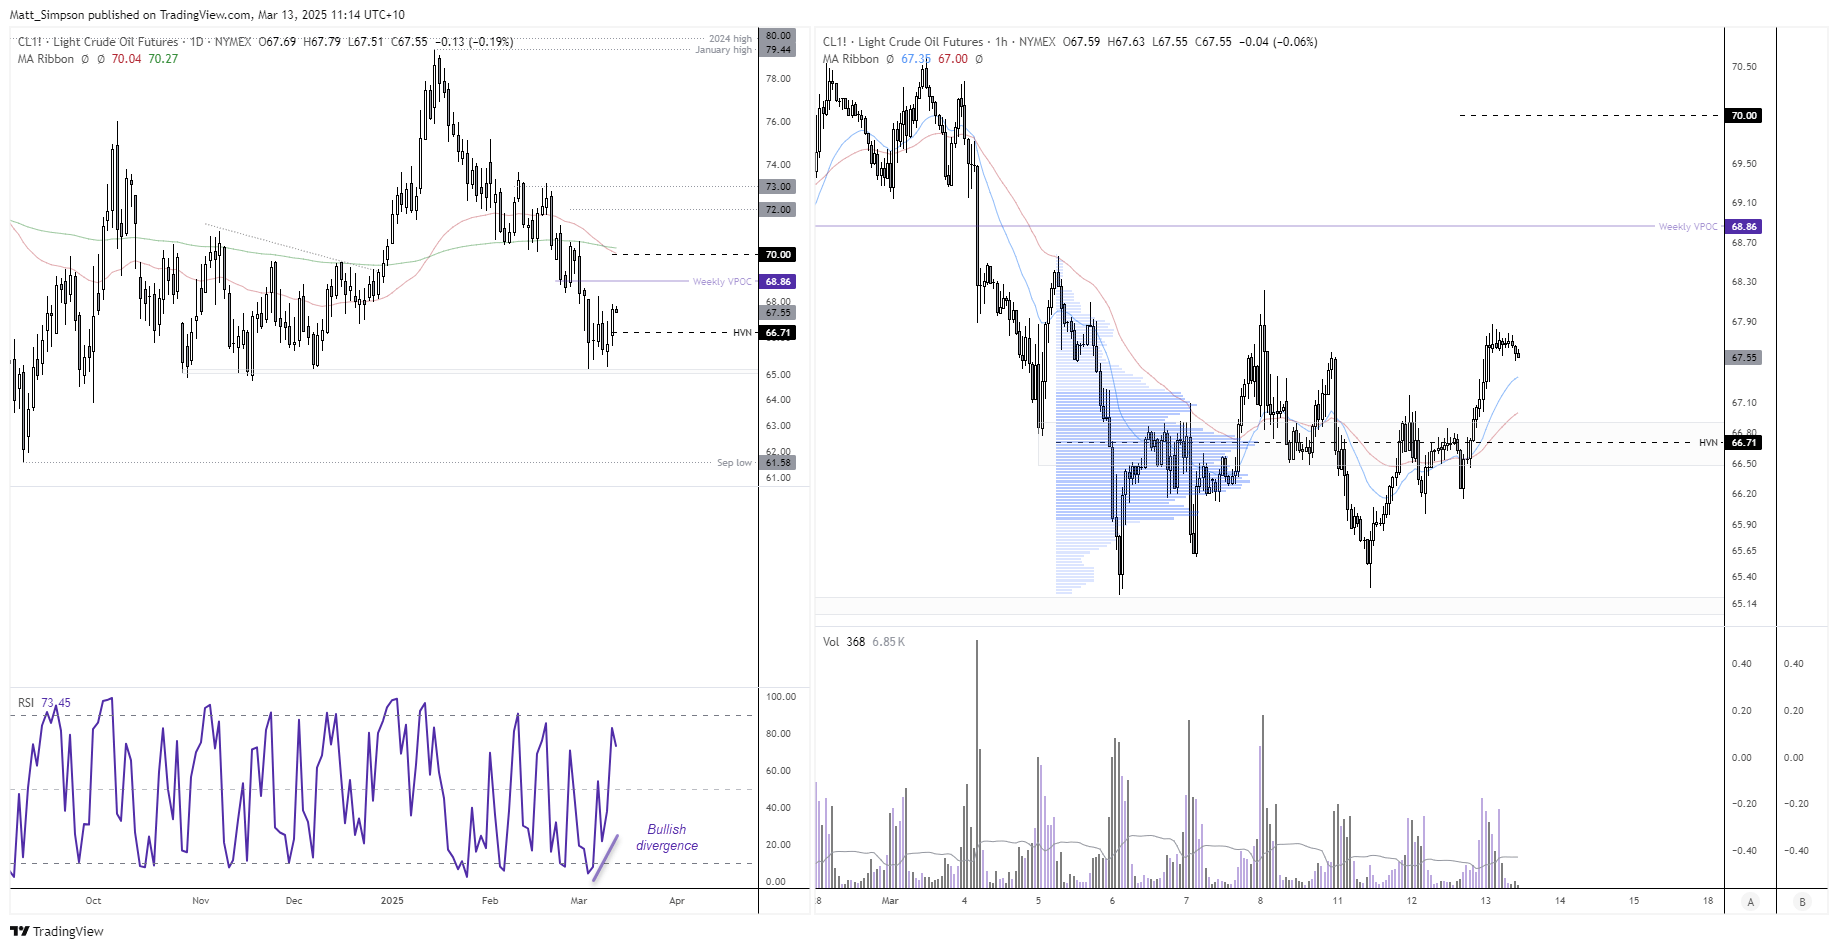
WTI Crude oil Technical Analysis
A double bottom has formed around $65, and Wednesday’s bullish range expansion formed the third candle of the bullish reversal pattern called a Morning Star. A bullish divergence also formed ahead of the minor rally. And with the two rallied from the cycle low on the 4-hour chart being accompanied with rising volumes, I suspect we have seen a near-term change in trend to the bull side.
The bias is to seek dips towards the high-volume node (HVN) at $66.71 in view of a move up to the $68.86 weekly VPOC (volume point of control), a break above which brings $70 into focus near the 50 and 200-day EMAs.
We’d like need a fresh catalyst to prompt decent-sized bulls from the sidelines before we could expect much more of a counter trend move. But if prices turn south and break beneath $65, $60 and the historic lows rom 2021 are the next major support levels for bears to focus on.
-- Written by Matt Simpson
Follow Matt on Twitter @cLeverEdge
Latest market news
September 18, 2025 02:48 PM
June 23, 2025 01:22 PM
June 23, 2025 10:39 AM
June 20, 2025 05:23 PM
June 20, 2025 04:46 PM
June 20, 2025 03:35 PM

June 9, 2025 03:52 PM

June 6, 2025 05:41 PM

May 21, 2025 07:02 PM

May 20, 2025 06:58 PM