

Key Events
- Crude Oil holds above the $55 support level, now facing $64 resistance for any sustained upside
- Nasdaq bounced off 2021 highs at 16,300 and now eyes the 19,400 resistance zone for further gains
- Upcoming CPI data, corporate earnings, and developments in the US-China trade war continue to pose downside risks
- Gold’s persistent strength near record highs reflects elevated safe-haven demand across markets
Crude Oil Bounces off Key $55 Support
As previously mentioned in my Sunday crude oil outlook articles, Crude Oil 2025 outlook, and most recent Q2 2025 Crude Oil Outlook:

A confirmed break below $60 risked extending losses to the critical $55 per barrel support. This level came into play on Wednesday, coinciding with an escalation in US-China tariff tensions, which have now reached nearly 100% on certain goods.
Following this decline, US equity indices managed to hold above key weekly support zones, which aligned with the December 2021 highs and oversold RSI levels not seen since 2020. The announcement of the 90-day tariff delay acted as a catalyst, sparking a sharp rebound toward resistance levels previously observed on both US indices and crude oil charts.
Nasdaq, Dow, SP500 Monthly Chart – Log Scale
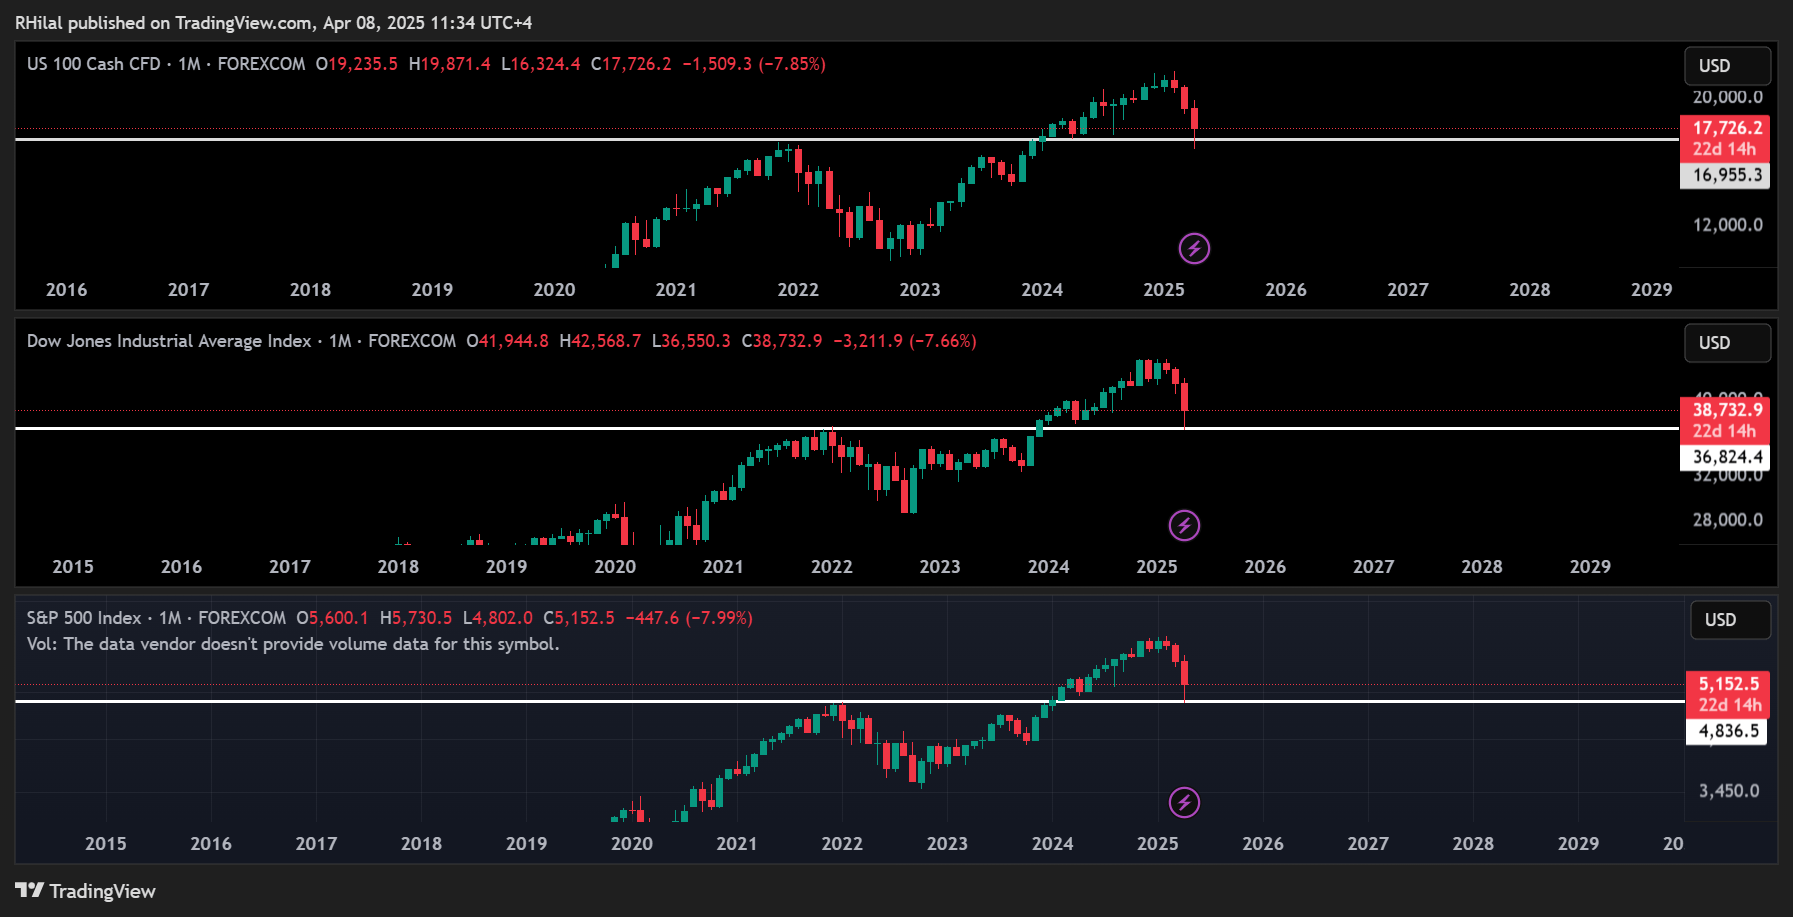
Source: Tradingview
Nasdaq, Dow, SP500, Crude Oil 4H Charts – Log Scale
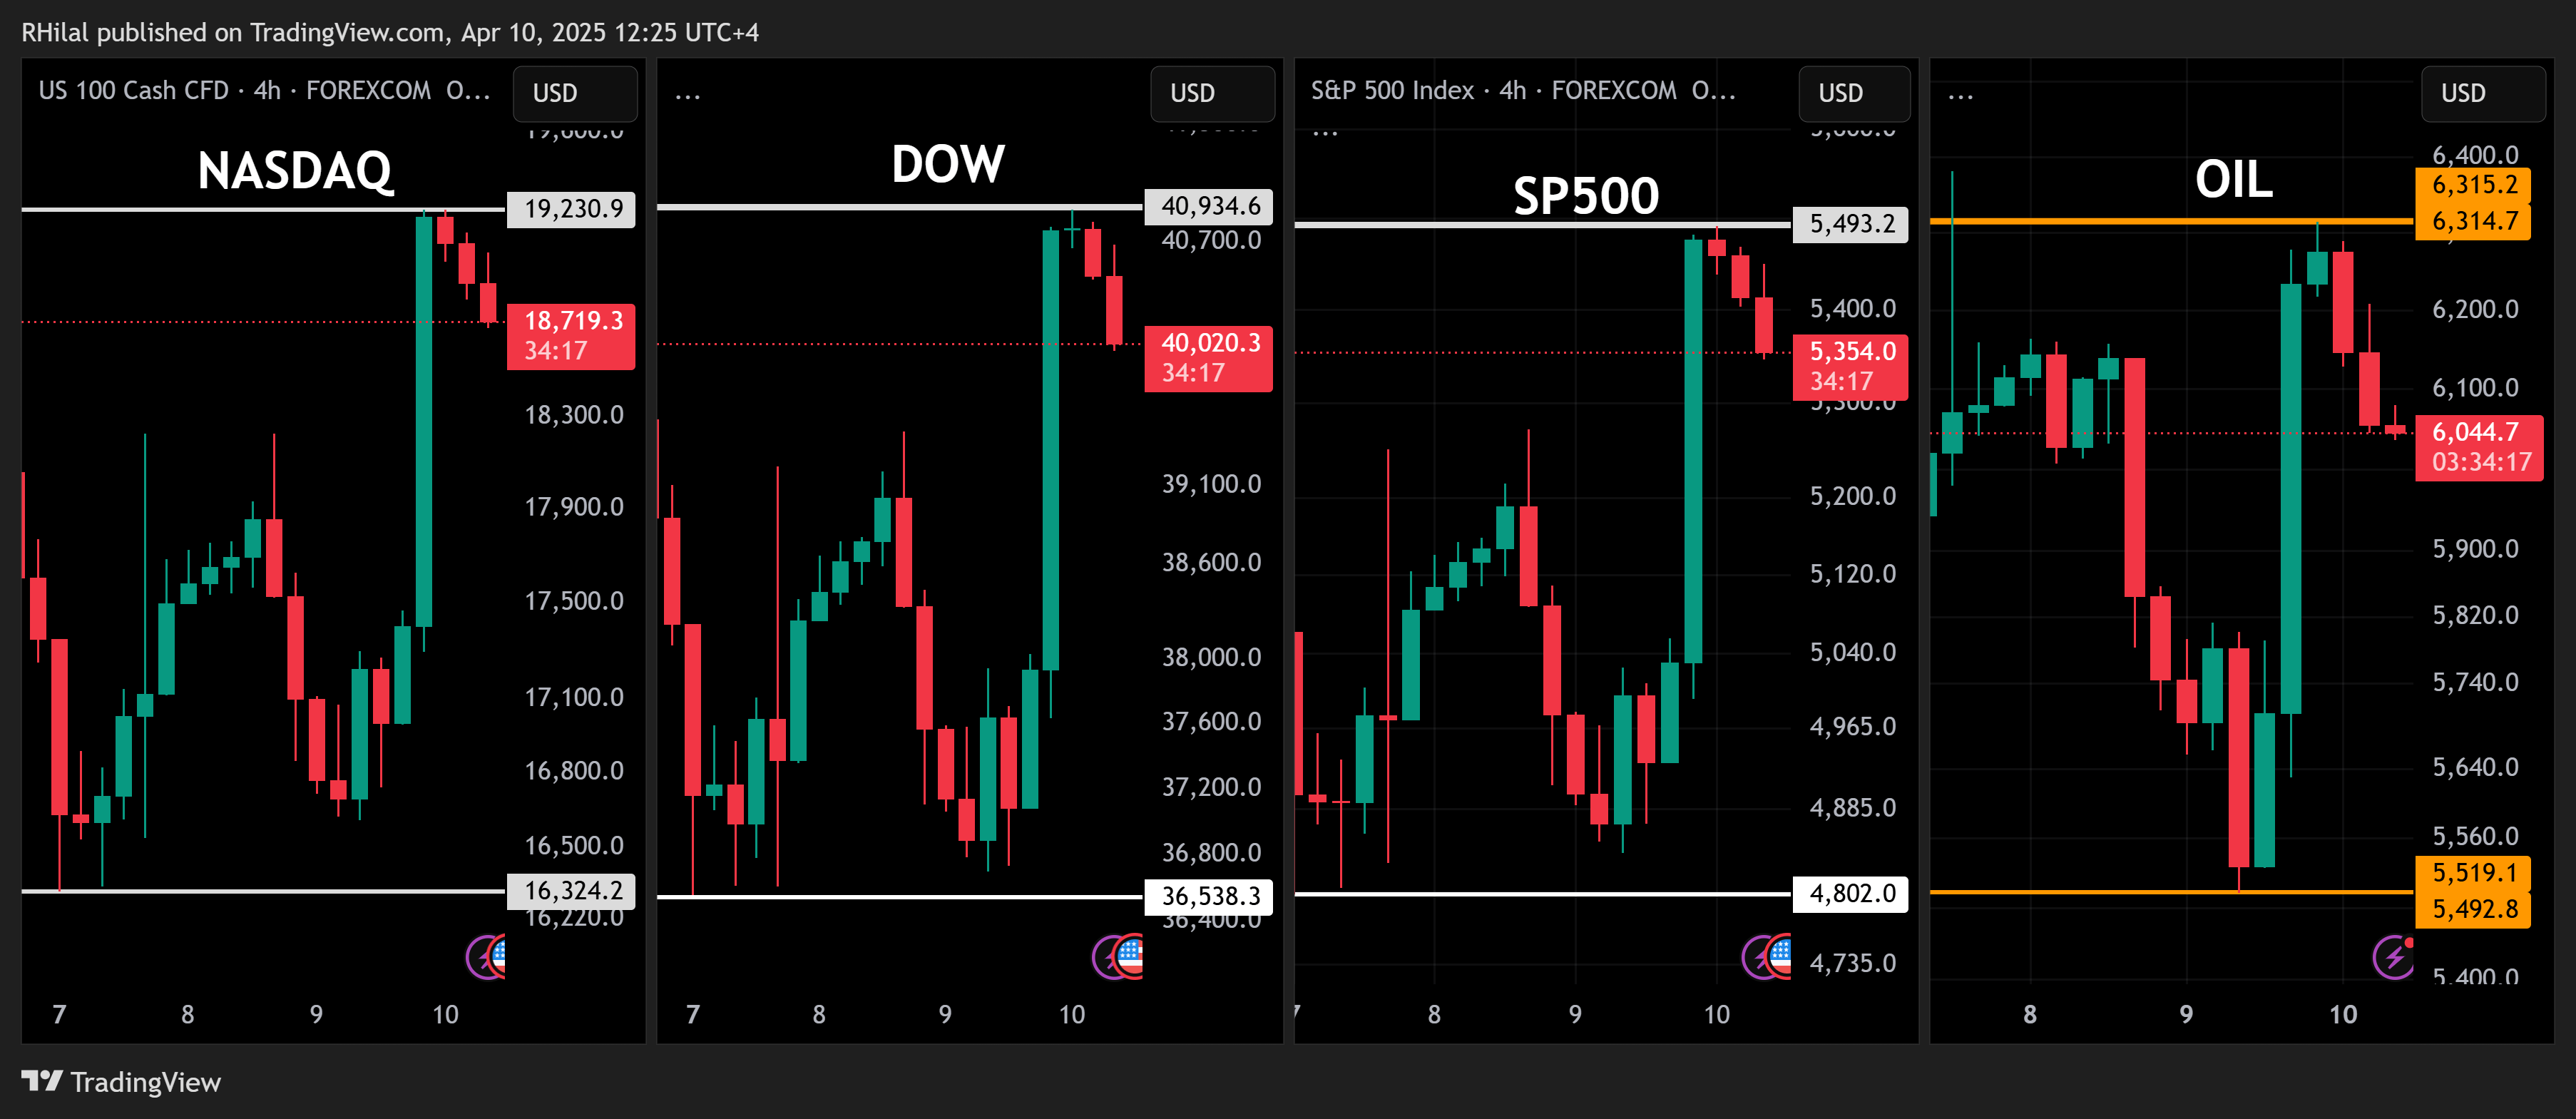
Source: Tradingview
While the tariff delay provided temporary relief, risks remain. The US-China trade dispute, gold’s resilience near all-time highs, and upcoming economic data—including inflation figures from both countries, US bank earnings on Friday, and consumer sentiment—continue to threaten the sustainability of recent market gains.
For now, markets appear to be tracing well-defined retracements ahead of the next major catalyst. Next charts highlight key levels to watch for Nasdaq and Crude Oil in the weeks ahead:
Crude Oil Forecast: Weekly Time Frame – Log Scale
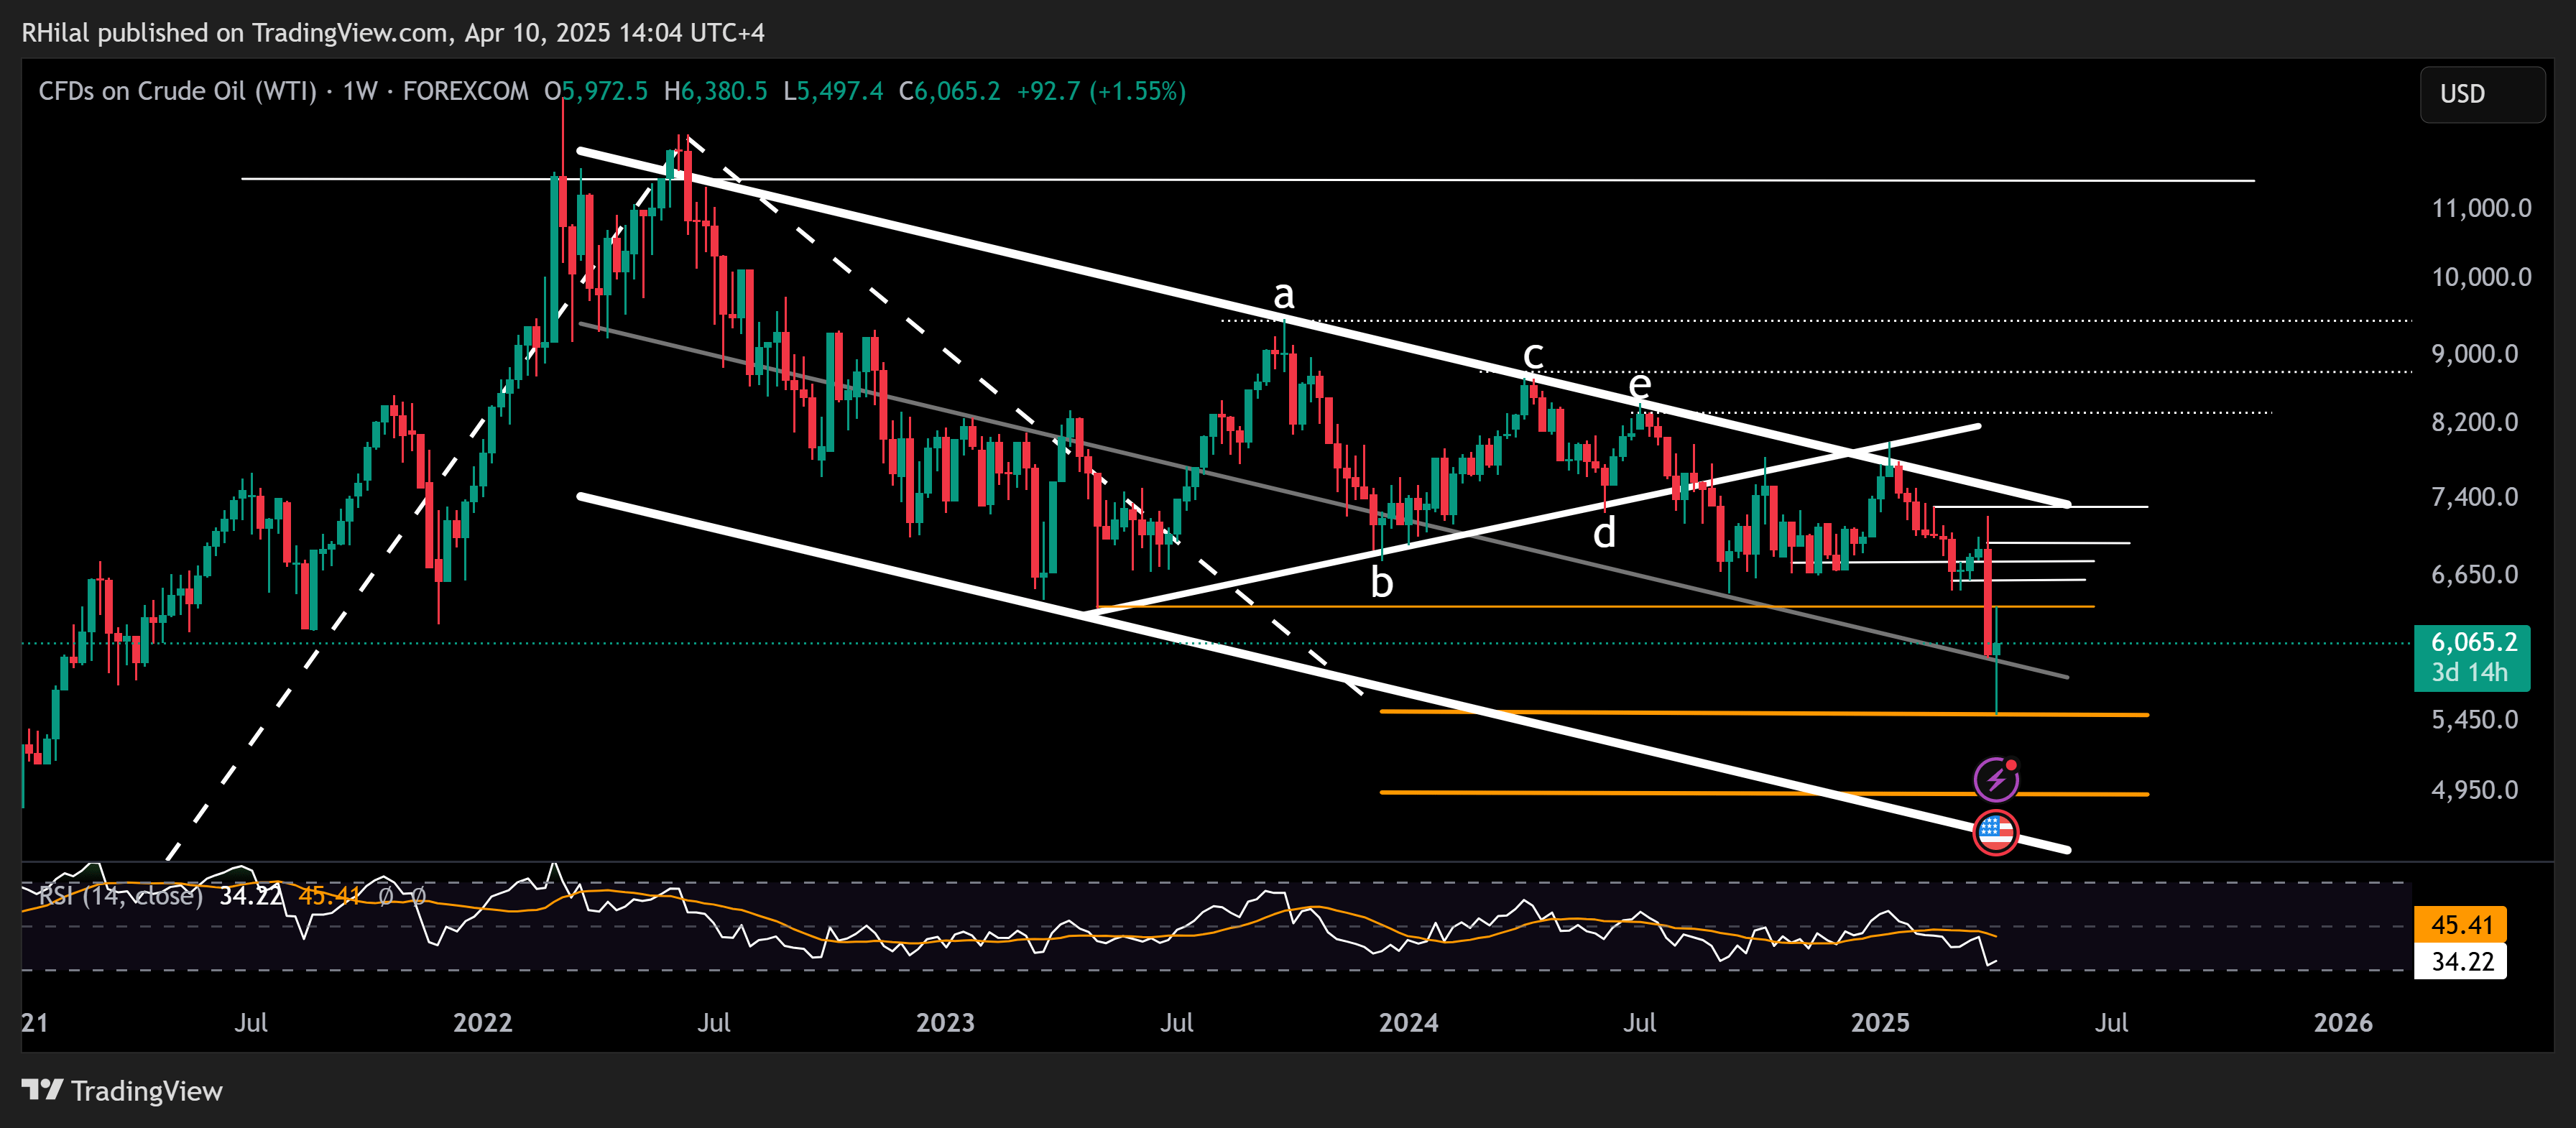
Source: Tradingview
Crude oil's sharp rebound from the $55 support—aligned with the 0.618 Fibonacci retracement of the 2020–2022 uptrend—faced immediate resistance at the long-standing support-turned-resistance zone around $63.80, established in 2021.
A decisive move above $63.80 may clear the way for further gains toward $66, $68, $69.60, and ultimately $73. On the downside, a drop below $58 would bring $55 back into focus. A clean break below that level could trigger further downside toward $49 per barrel, which aligns with the lower boundary of crude oil's long-term uptrend, as outlined in my Q2 Outlook.
Nasdaq 3-Day Time Frame – Log Scale
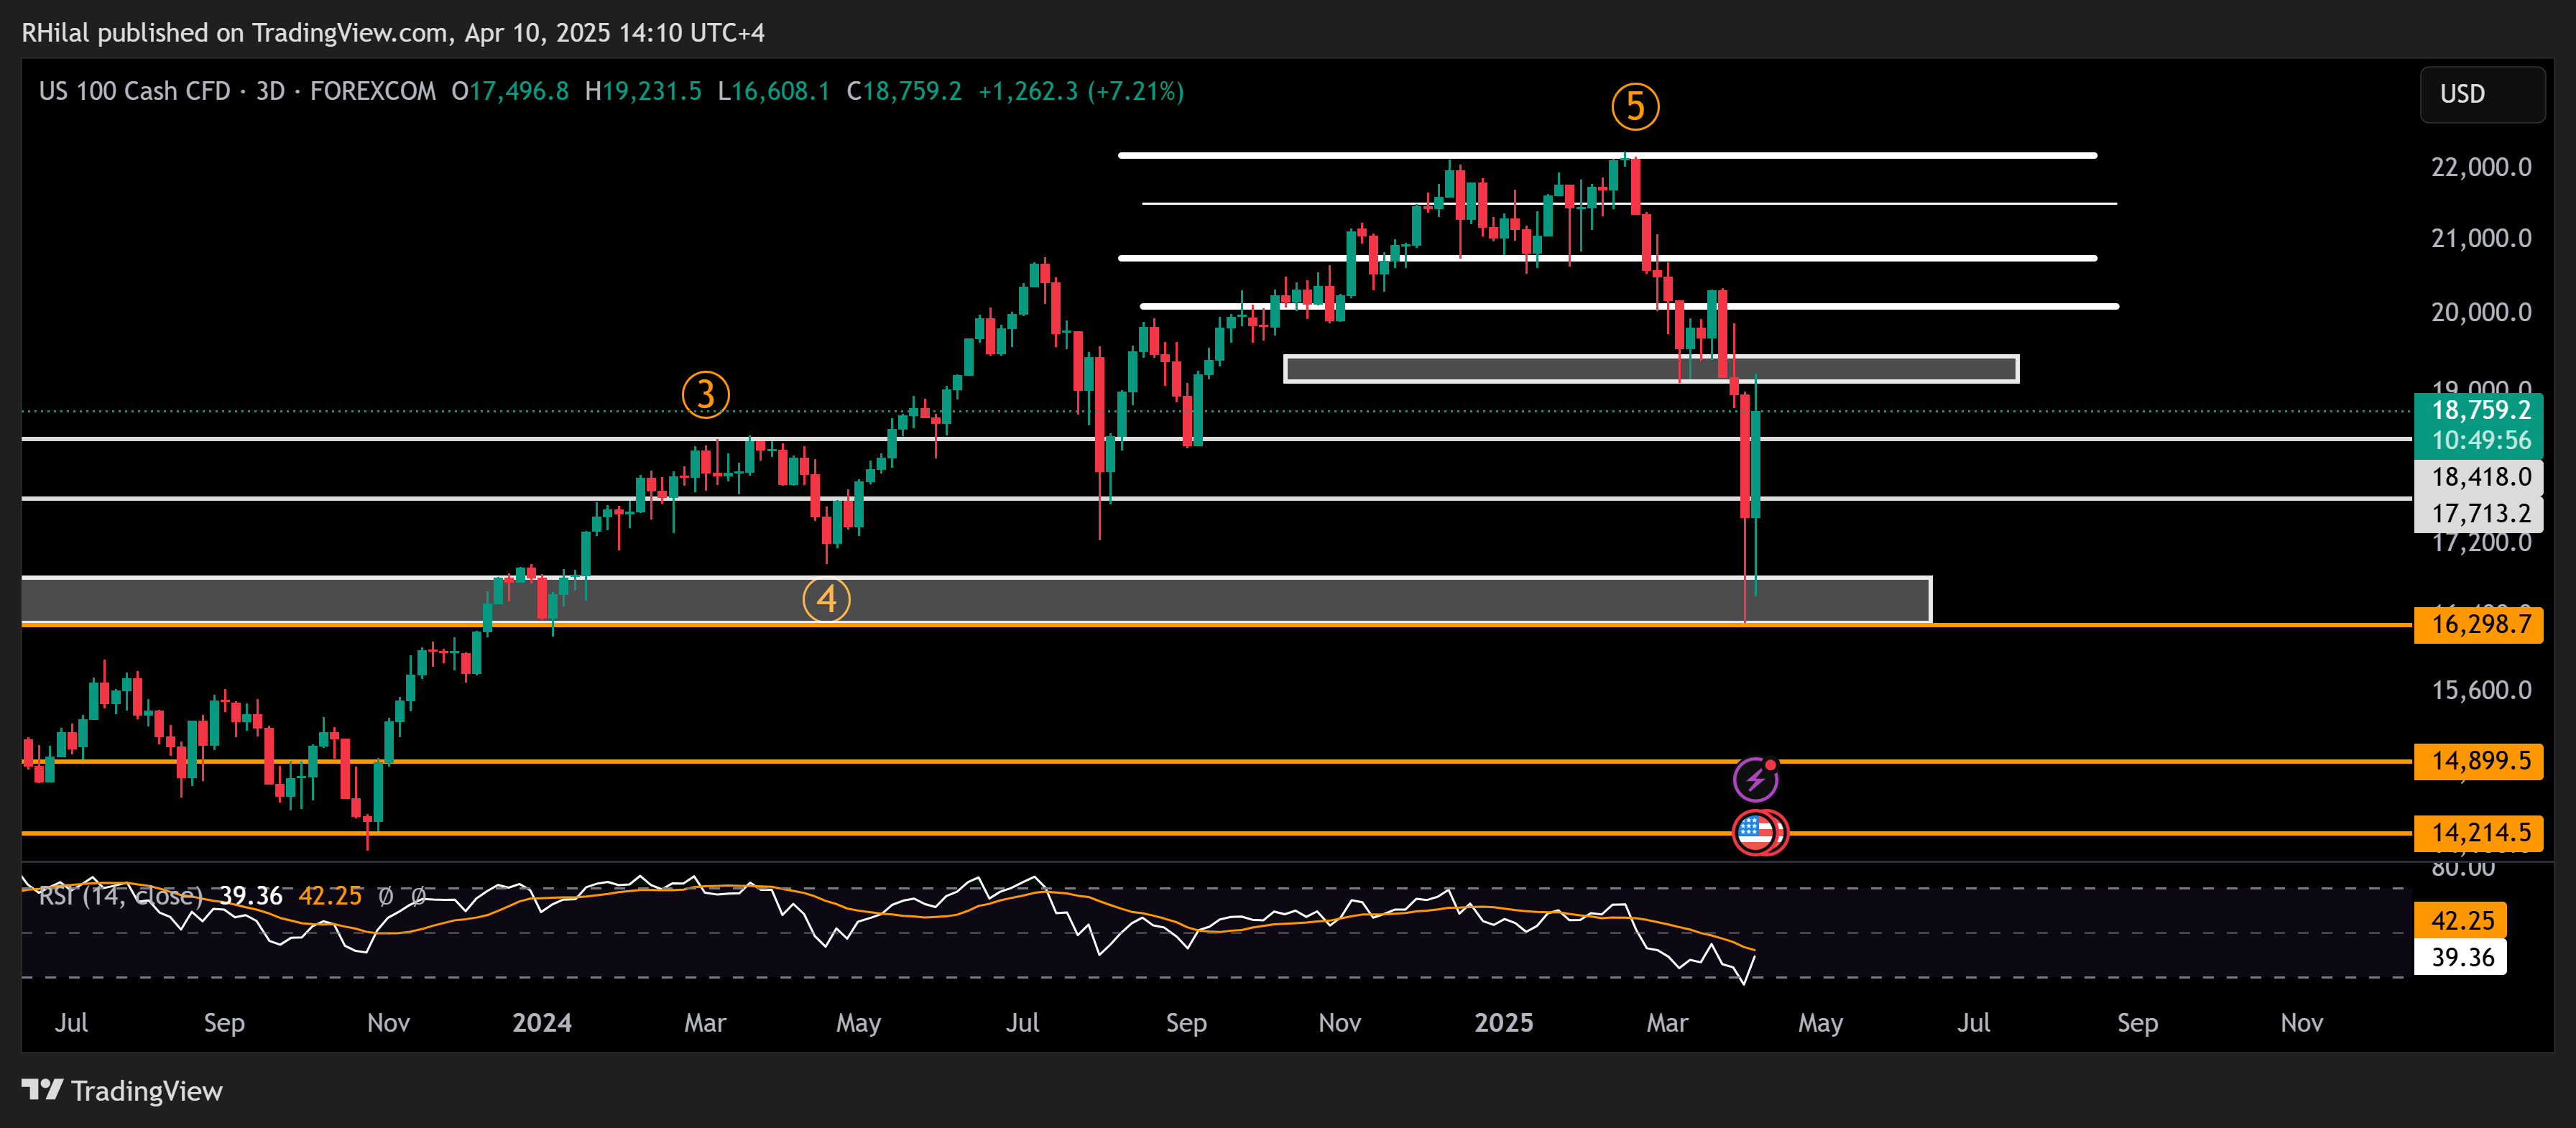
Source: Tradingview
The Nasdaq rebounded off the 2021 highs and the 50% Fibonacci retracement of the October 2022–February 2025 rally. This bounce coincided with a deeply oversold momentum signal, also last seen in 2020.
Price is now testing a major resistance zone between 19,100 and 19,400. A confirmed break and hold above 19,500 could open the door to further gains toward 20,000, 20,800, 21,500, and possibly 22,000+. However, failure to sustain above 18,200 could expose the index to renewed downside risk, with potential pullbacks to 17,700, 17,000, and 16,300.
A new 2025 low below 16,300 would break the market structure and may trigger deeper losses toward 14,900–15,000, aligning with the 0.618 Fibonacci retracement of the 2022–2025 uptrend and possibly signaling a broader market correction.
Written by Razan Hilal, CMT
Follow on X: @Rh_waves
Latest market news

April 25, 2025 09:13 AM

April 10, 2025 10:20 AM

April 7, 2025 09:40 AM

March 27, 2025 09:25 AM