

Key Events to Watch:
- Major U.S. economic data releases under tariff pressure: ISM PMIs and NFPs
- Crude oil sustains support above $63 amid trade talks and rising geopolitical risks
- Nasdaq tests 21,800 resistance ahead of a potential retest of record highs
Tariff Anticipations and Solid Economic Data: Who’s in the lead?
As markets move on forward looking anticipation, trade headlines seem to be keeping critical charts in a bullish mode, with the US Dollar index above its 2025 extremes above the 98-support, Nasdaq above the 21000 mark, and crude oil on a positive track from summer demand and outlook anticipations perspective, keeping in mind the latest surge was fueled by escalations between Russia and Ukraine.
Until trade court decisions play out and NFPs get released, what are the key levels to watch?
Crude Oil Outlook: Daily Time Frame – Log Scale

Source: Tradingview
Crude oil is benefiting from a combination of tariff block optimism, risk premiums, and seasonal demand, which is helping tilt sentiment to the bullish side. On the daily chart, crude has broken out above a two-week triangle consolidation, signaling potential for further upside.
Key Scenarios to Watch:
Bullish Scenario:
A sustained move and firm hold above the $65 zone could open the door for gains toward $66.90, $69.30, and ultimately $71.00.
Bearish Scenario:
A drop below the $60 level may invite further downside, targeting $59.20, $58.30, and the crucial $55 support. This level carries major weight from both a weekly momentum and Fibonacci standpoint and may serve as a long-term bullish pivot. If breached, the next meaningful support lies near $49, which could become the next accumulation zone /renewed long-term bullish positioning.

Nasdaq Outlook: Daily Time Frame – Log Scale
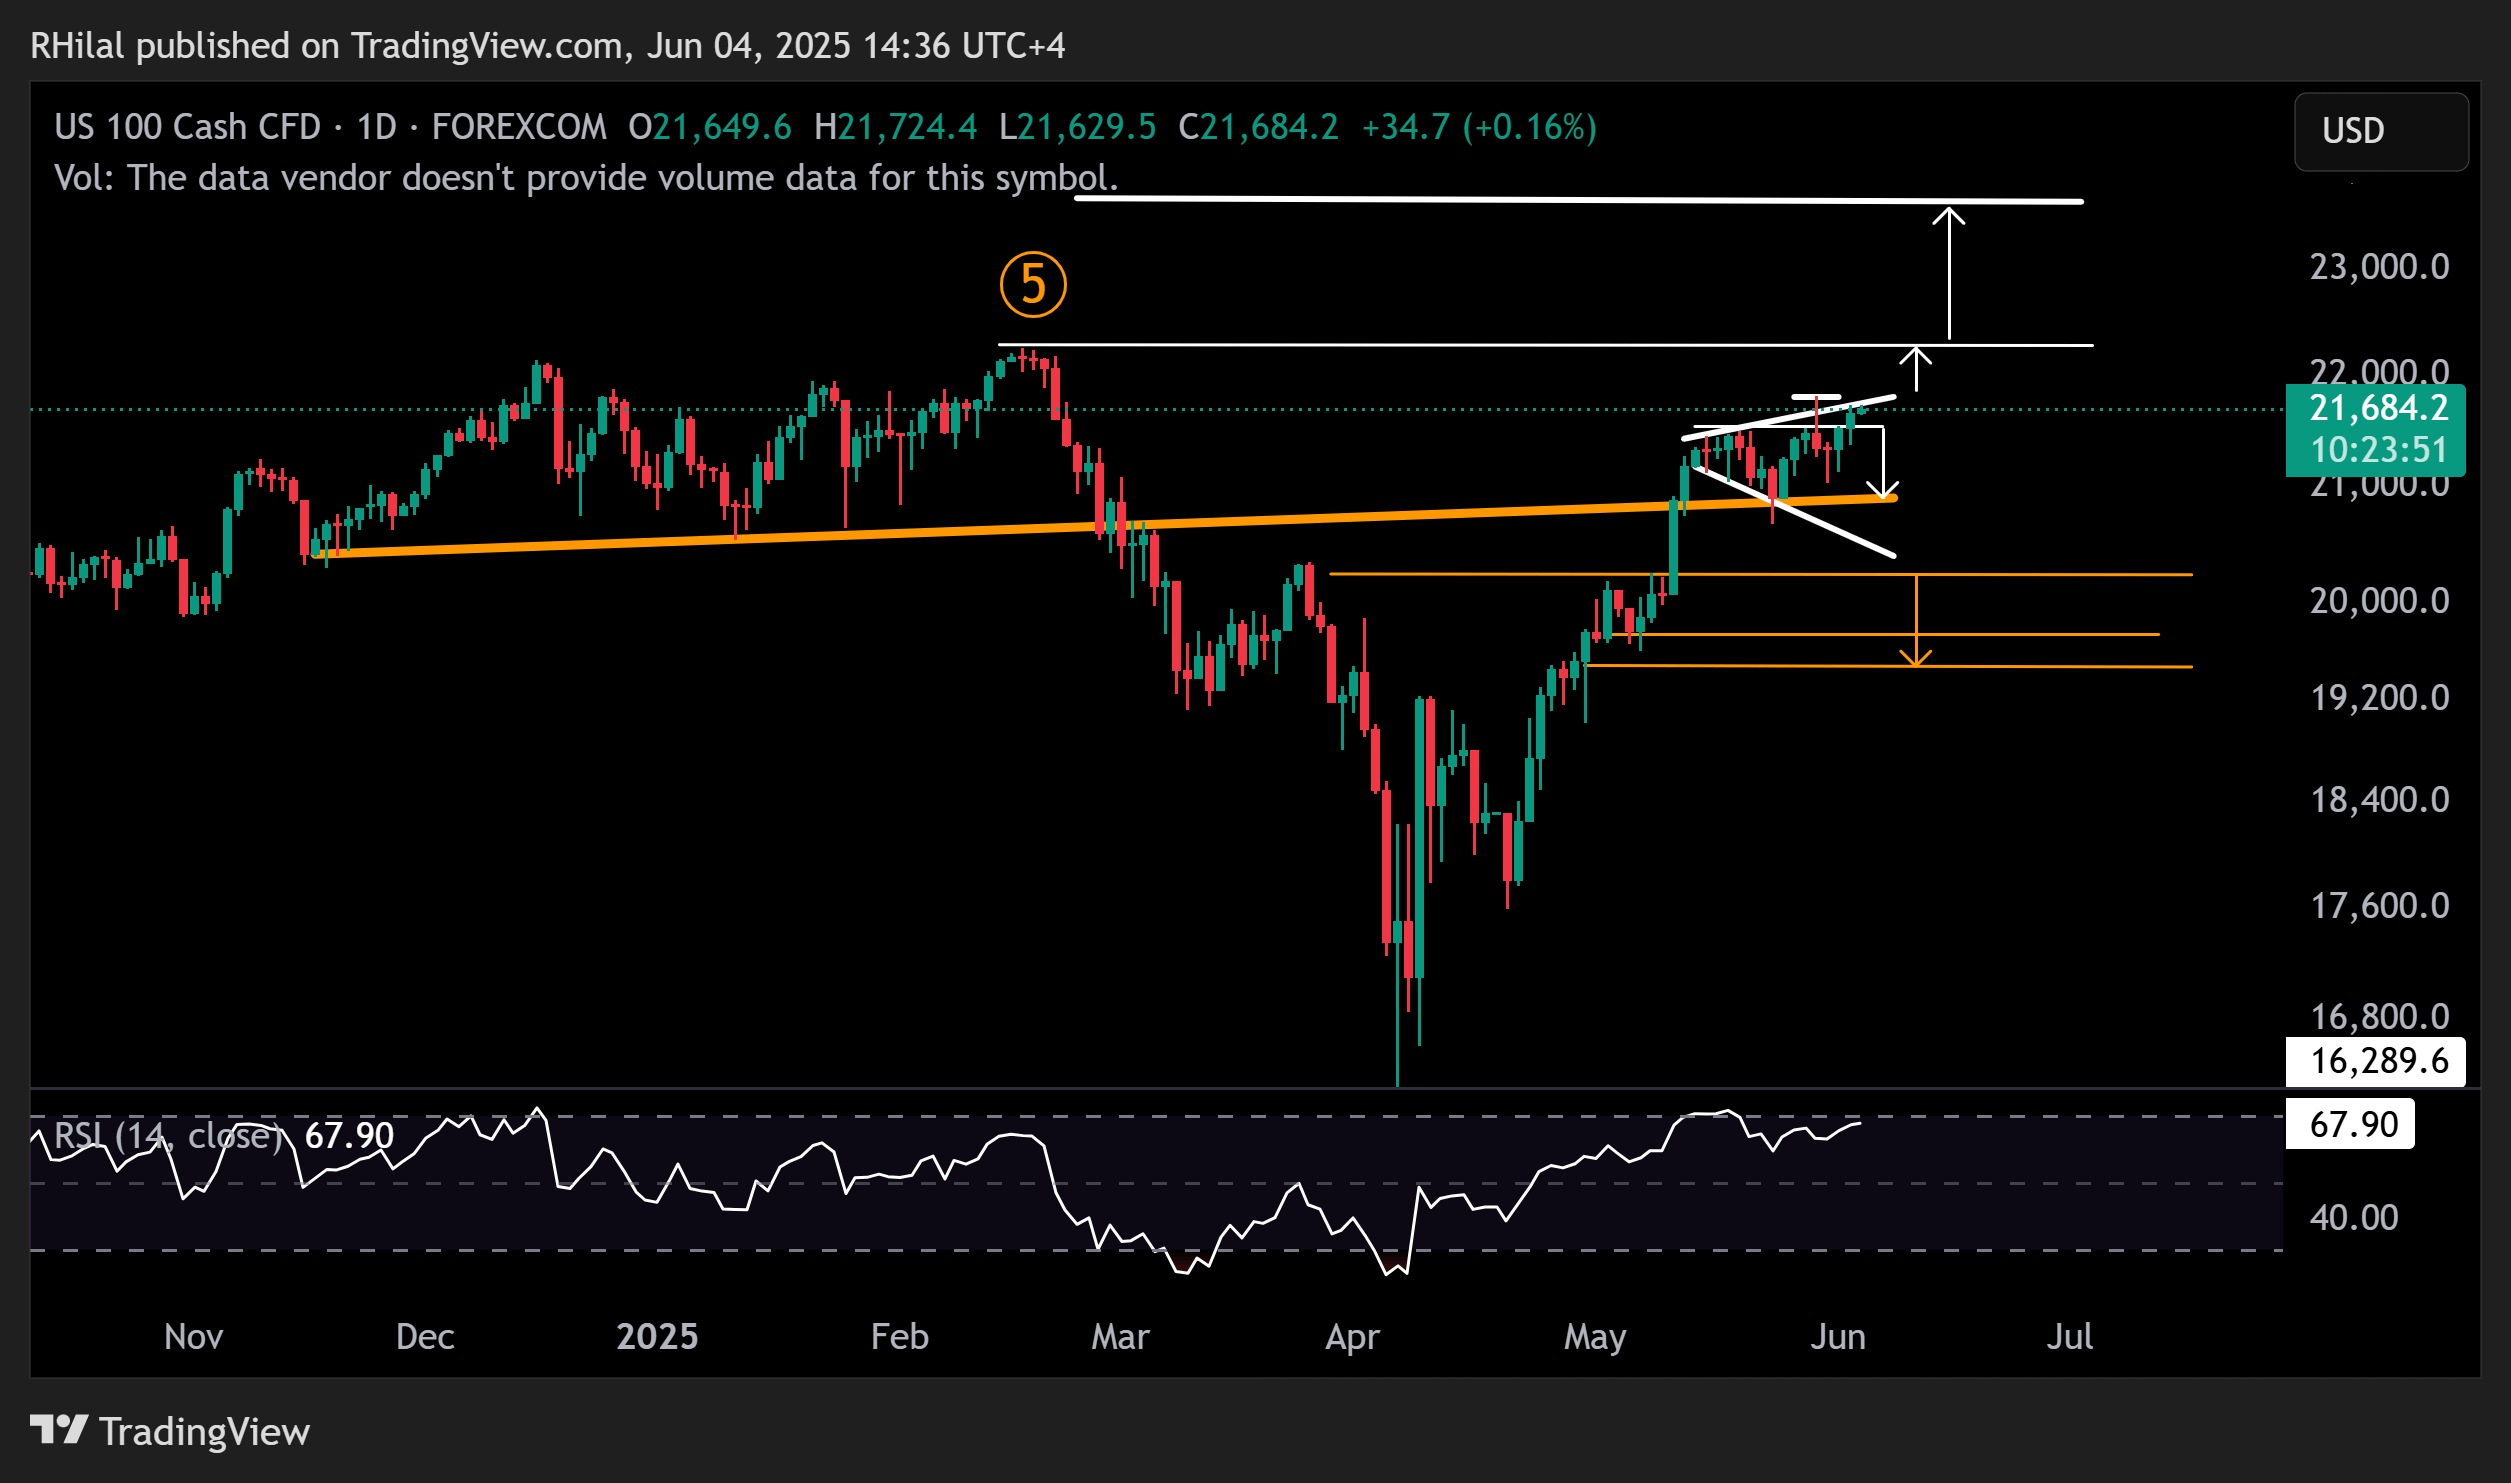
Source: Tradingview
Despite trade-related headwinds, the tech and AI sectors remain resilient, helping to keep the Nasdaq in bullish territory. The index continues to build an expanding consolidation pattern above the neckline of a double top formation that developed between December 2024 and February 2025.
Nasdaq is now testing the 21,800-resistance, with upside potential toward the record high at 22,200 and 23,700.
Downside levels to watch:
If Nasdaq pulls back below 21,500, support levels to monitor include 21,000 and 20,800. A deeper correction could then extend toward 20,200, 19,700, and 19,100 respectively.

Written by Razan Hilal, CMT
Follow on X: @Rh_waves
Latest market news
September 18, 2025 02:48 PM
June 23, 2025 01:22 PM
June 23, 2025 10:39 AM
June 20, 2025 05:23 PM
June 20, 2025 04:46 PM
June 20, 2025 03:35 PM

June 9, 2025 10:32 PM

April 7, 2025 03:32 AM

April 3, 2025 03:23 AM

January 15, 2025 10:26 PM