

Key Events to Watch
- Trump-driven market sentiment: U.S. debt concerns, GDP outlook, and tariff negotiation tactics
- Geopolitical risks: Israel, Iran, and Russia
- OPEC supply cuts unwinding—yet oil still holds above $55
- NVIDIA earnings on Wednesday
Despite headlines citing depressed oil prices, shaken market confidence from Trump tariffs, and U.S. debt concerns, WTI is still holding firm above the $60 psychological level. Last week ended with a 50% Eurozone tariff market slump, and this week opened with a tariff delay to allow negotiations to proceed—clarifying Trump’s tariff negotiation tactics between setting the bar too high and then extending deadlines for reasonable talks to take place.
The dollar seems to be taking the major hit, aligning major currency and commodity pairs on a bullish track. Equities are holding their pullbacks from bullish territories, with the Nasdaq in the lead and eyes on AI projects and NVIDIA earnings this Wednesday.

Oil’s rebound reflects priced-in oversupply fears from OPEC’s unwinding and trade headlines. New market drivers include Trump’s evolving policies, revised tariff timelines, and persistent debt concerns, all weighing on sentiment as the quiet summer season begins.
Geopolitical risks also loom: Democratic concerns over U.S.–Gulf AI deals potentially leaking to China or Russia could trigger bearish reactions, while the Israel–Iran conflict may fuel upside risk if oil supply is affected. For now, attention is on summer demand and the final U.S. GDP reading due Thursday.
With the dollar at its lowest since 2023, what are the key levels to watch for crude oil?
Crude Oil Weekly Outlook: 3-Day Time Frame – Log Scale
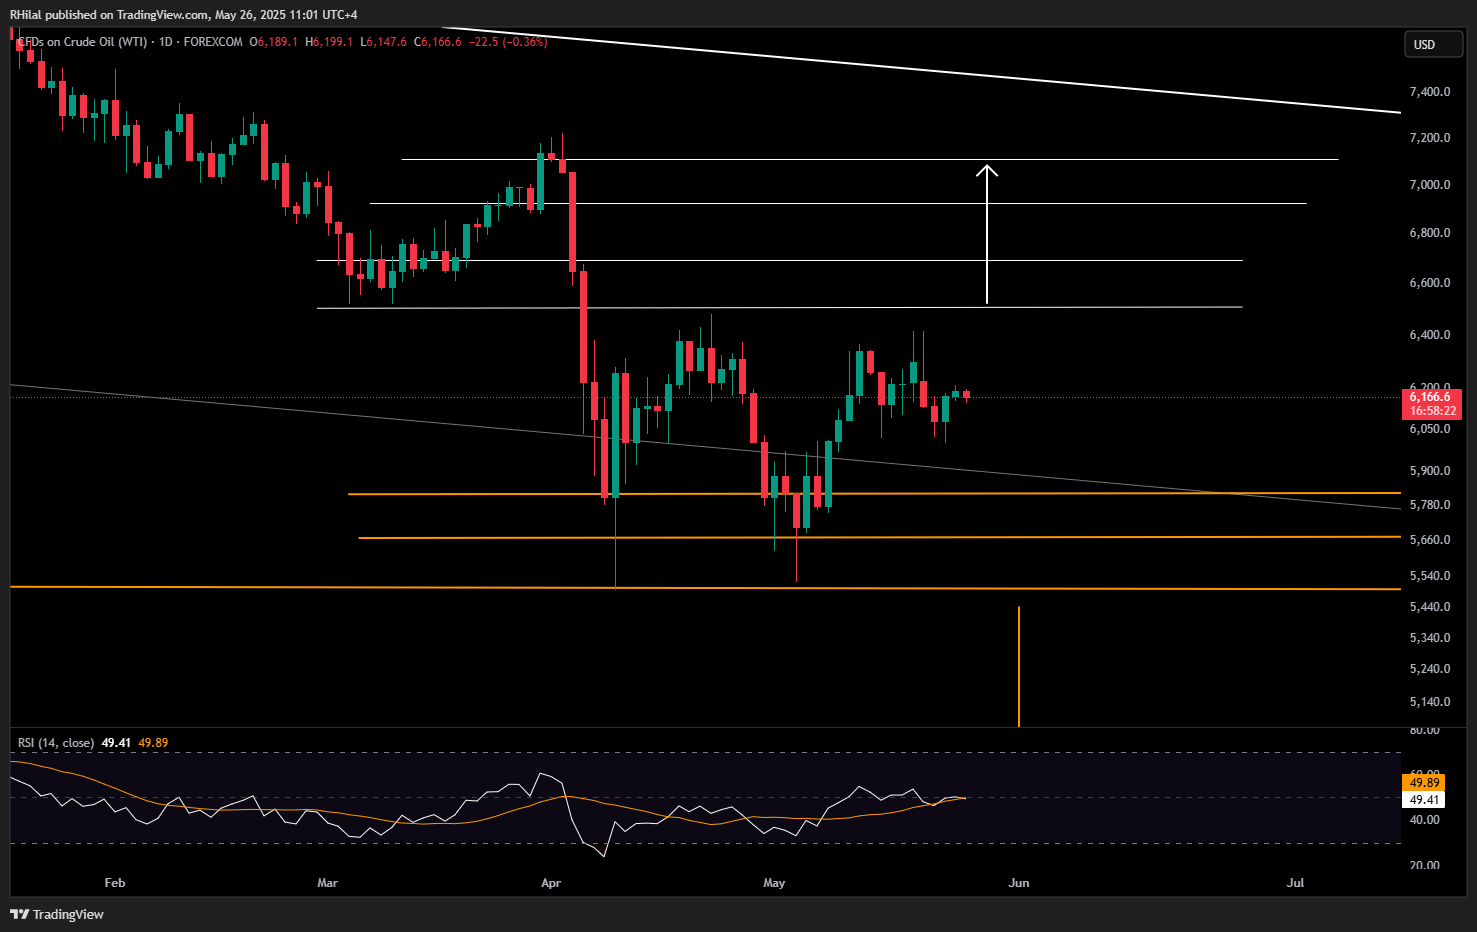
Source: Tradingview
Crude oil remains locked in a resilient sideways range, with strong support between $55 and $58, and a key resistance zone between $63 and $65. Momentum indicators are mixed:
-
Daily RSI remains neutral, allowing for both bullish and bearish scenarios.
-
Weekly SI shows a clean bounce from 2020 extremes, suggesting underlying bullish potential.
Scenarios to Watch
Bullish Scenario:
A sustained move above $63.80–$65 could pave the way for gains toward $66.90, $69.20, and $71.
Bearish Scenario:
A decisive break below $58 would expose downside risk toward $56.70 and $55. In the case of extreme market turbulence, further losses toward $49 remain possible—potentially setting up for a new long-term bullish positioning.
Written by Razan Hilal, CMT
Follow on X: @Rh_waves
Latest market news
September 18, 2025 02:48 PM
June 23, 2025 01:22 PM
June 23, 2025 10:39 AM
June 20, 2025 05:23 PM
June 20, 2025 04:46 PM
June 20, 2025 02:18 PM

June 19, 2025 09:09 AM

June 18, 2025 02:55 PM

June 18, 2025 08:19 AM

June 18, 2025 02:21 AM