

Over the past five trading sessions, the U.S. index has sustained a strong bullish movement, gaining more than 3.5% in the short term. However, this advance is now facing resistance at the 42,000-point level, where the price has begun to stabilize after a buying streak. Confidence in the current uptrend has been driven, in part, by the recent easing of trade tensions and expectations of lower inflation in the United States. If these factors persist, they could become key drivers of future buying pressure on the Dow Jones.

Factors Supporting Confidence in the Dow Jones
First, it’s important to note that U.S. equity indices have shown high sensitivity to global economic and political uncertainty. This week has been crucial, as President Trump’s administration, during a weekend meeting, announced a short-term easing of trade conflict. A 90-day tariff pause has been agreed, with the U.S. lowering tariffs from 145% to 30% on Chinese products, while China will reduce its tariffs from 125% to 10% on U.S. goods. This agreement represents a key milestone in the development of the trade war and has contributed to gradual confidence returning to the markets, helping to sustain demand for the Dow Jones.
Additionally, a major driver this week was the release of U.S. inflation data. On May 13, the year-over-year CPI came in at 2.3%, below the expected 2.4%. This reinforces the idea that inflation is easing, approaching the Fed’s 2% target. As a result, expectations of a potential rate cut have risen, which would translate into cheaper credit, higher consumption, and consequently, greater support for the Dow Jones.
However, it's important to note that this possible shift in rate expectations is not yet reflected in the Fed's rate probability models. According to CME Group, there is a 91.6% probability that the rate will remain at 4.5% at the upcoming June 18 meeting.
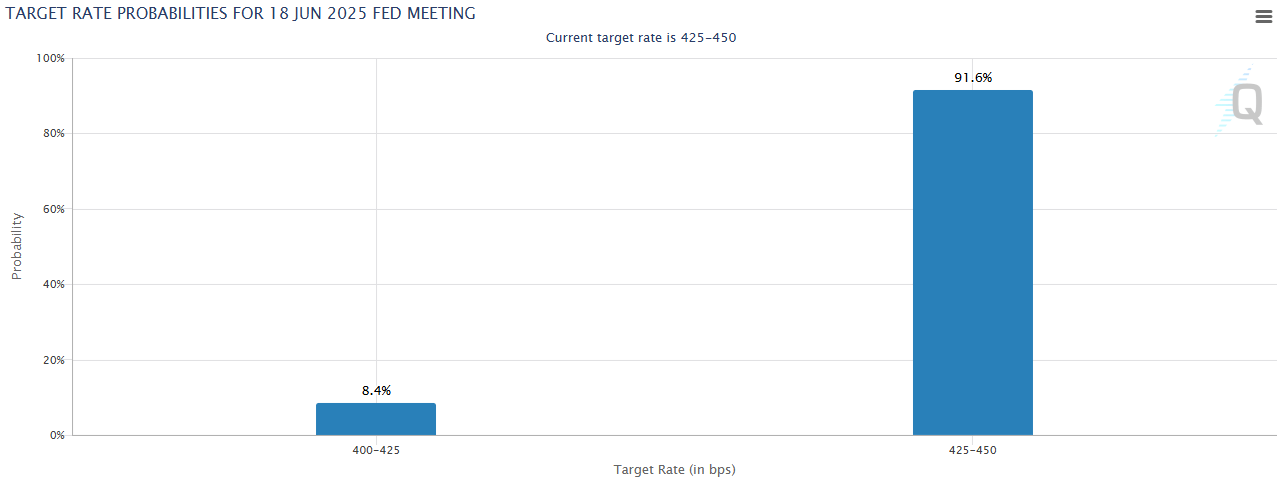
Source: CME Group
In this context, recent bullish momentum in the Dow Jones is supported by hopes for a trade resolution and a softer Fed tone. However, it is crucial that these drivers remain intact for demand to continue. If any unexpected event undermines market confidence, a significant bearish correction could emerge.
Market Sentiment
The CNN Fear & Greed Index, which gauges current market sentiment, is hovering around 75 points, the threshold between the “greed” and “extreme greed” zones.
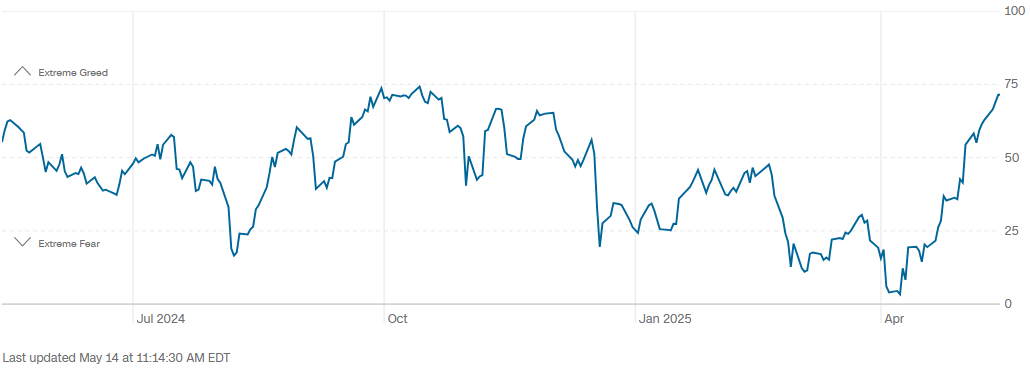
Source: CNN
This reflects the rapid recovery in market sentiment in recent sessions, fueled by a renewed appetite for risk among investors, which has generated consistent demand for the Dow Jones. However, it’s worth remembering that this year’s confidence levels have been highly sensitive to economic and political events and could shift quickly if fears—such as a new trade war escalation—resurface. If the index stays above 75 points, this could support sustained buying pressure in the short term.
Dow Jones Technical Outlook
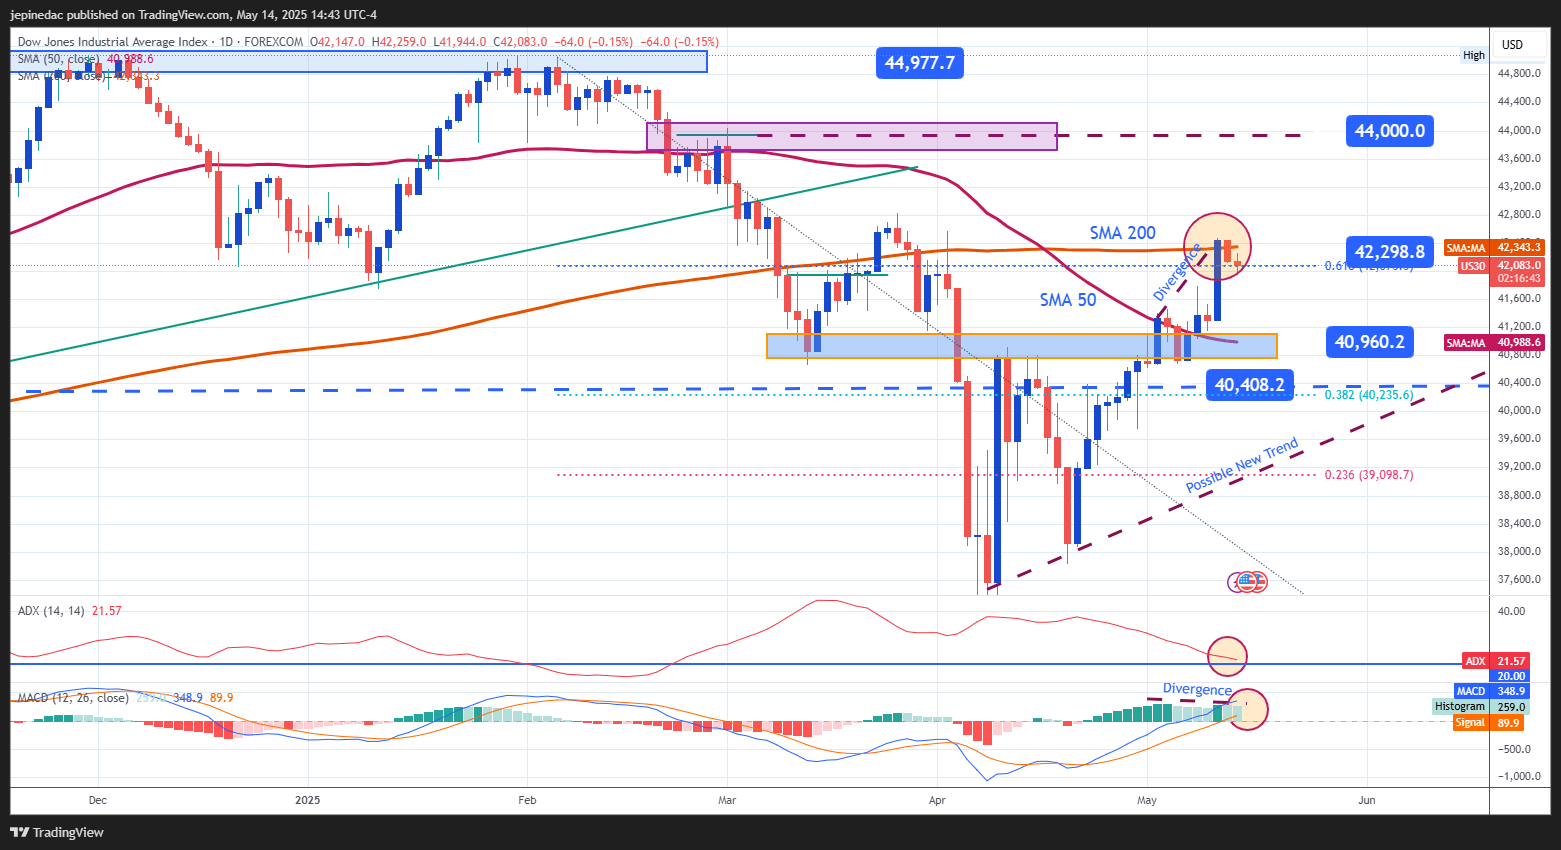
Source: StoneX, Tradingview
- Bullish Trend: Since early April, Dow Jones has formed a solid bullish trend, confirming the dominance of buying momentum. However, the price has now found technical resistance near 42,200 points, which is currently the most critical level. So far, there are no clear signals of a bearish correction threatening the structure, which remains the dominant formation in the short term.
- ADX: The ADX line is approaching the neutral 20 level, suggesting that volatility has declined in recent movements. If the ADX continues to fall, this could signal a shift toward neutral or range-bound trading in the near term.
- MACD: The MACD histogram has started to show lower highs, while the Dow Jones continues to post higher highs. This divergence suggests a potential imbalance between price action and momentum, which could open the door to short-term bearish corrections if the pattern continues.
Key Levels:
- 42,200 points – Immediate Resistance: Aligns with the 200-period simple moving average. A breakout above this level would confirm buying strength and open the door to a more consolidated uptrend.
- 44,000 points – Distant Resistance: A psychological round-number zone that coincides with neutral price action observed in February. If price reaches this level, it could attempt to retest all-time highs.
- 41,000 points – Key Support: Aligned with the 50-period simple moving average, this level acts as a short-term floor. A drop to this zone could trigger a renewed bearish bias and delay the current uptrend.
Written by Julian Pineda, CFA – Market Analyst
Follow him at: @julianpineda25
Latest market news
September 18, 2025 02:48 PM
June 23, 2025 01:22 PM
June 23, 2025 10:39 AM
June 20, 2025 05:23 PM
June 20, 2025 04:46 PM
June 20, 2025 03:35 PM

September 18, 2025 02:48 PM

June 18, 2025 08:37 PM

June 13, 2025 06:22 PM

June 12, 2025 03:40 PM