

Shortly after the Dow Jones reached a low near 36,500 points, the index has posted a notable rebound, gaining more than 9% over the last four trading sessions. This renewed bullish bias is holding as new updates on the trade war have helped ease the prevailing fear in the markets. If tensions continue to ease, this could be seen as a key factor in boosting risk appetite in the short term.

New Developments in the Tariff War
One of the most relevant events last week was President Donald Trump’s announcement of a pause in tariffs for dozens of countries, redirecting the trade war focus exclusively toward China with a 145% tariff, which could increase further if Beijing does not respond favorably. In retaliation, China announced that, starting April 11, tariffs on U.S. goods would rise to 125%.
However, it was also reported that the White House is planning tariff exemptions for key tech products such as cell phones, computers, microchips, monitors, and smartwatches imported from China. This measure aims to relieve short-term pressure on the electronics sector.
This partial relief has helped restore short-term market confidence, which in turn has supported a recovery in Dow Jones component stocks. It’s possible that more exemptions will be extended to other products this week, as economic pressure mounts on the U.S. administration. In the case of Dow Jones, the bullish momentum has been driven mainly by strong performances among its top 5 components: Goldman Sachs rose 1.34%, Microsoft gained 0.84%, Home Depot added 0.36%, and Sherwin-Williams climbed 0.44%. The only notable laggard was UnitedHealth Group, which declined 1.14%.
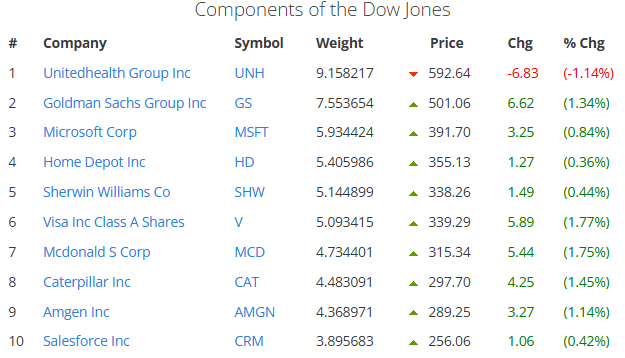
Source: Slickcharts
Still, it’s important to note that this tariff exemption has been described as temporary, and if the White House returns to a more aggressive stance toward China, recent optimism could quickly fade, bringing back renewed selling pressure on the Dow Jones. In this context, the index’s recovery will largely depend on improving market confidence.
How Is Market Sentiment Holding Up?
The AAII Investor Sentiment Survey, which gauges investor outlook over the next six months, shows that as of April 9, 28.5% of respondents maintain a bullish view, 12.5% are neutral, and 58.9% hold a bearish outlook on the market.
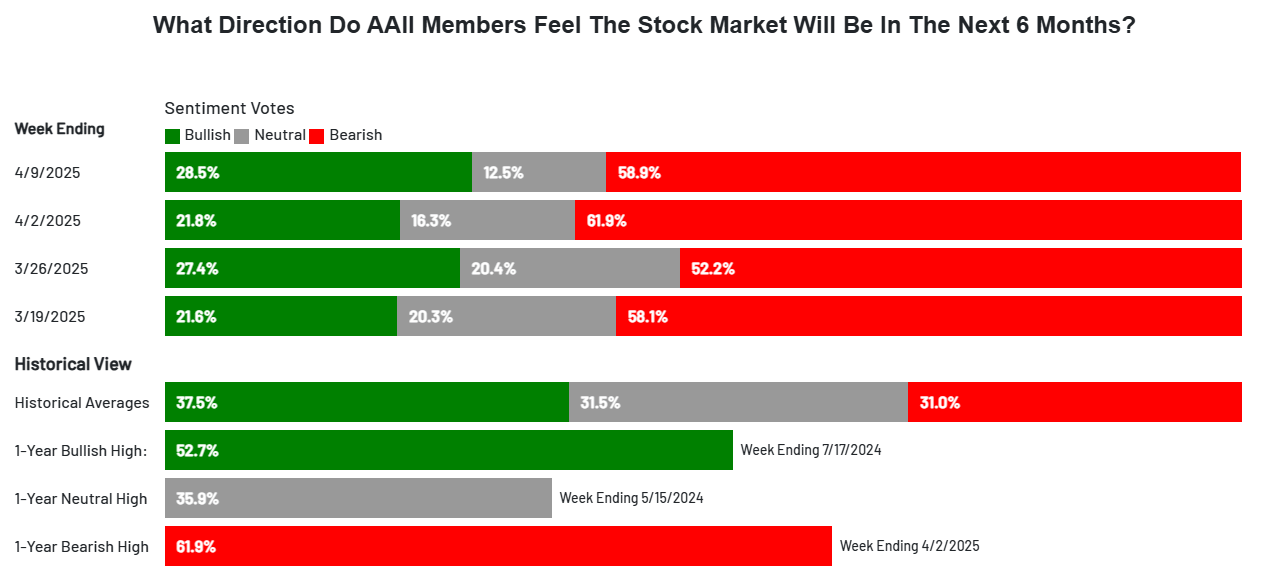
Source: AAII
This outlook confirms that market sentiment remains predominantly bearish, likely due to the unresolved trade war. If confidence fails to stabilize in the coming weeks, investors may shift toward safer assets like U.S. Treasuries, which could once again exert downward pressure on the Dow Jones.
Dow Jones Technical Outlook
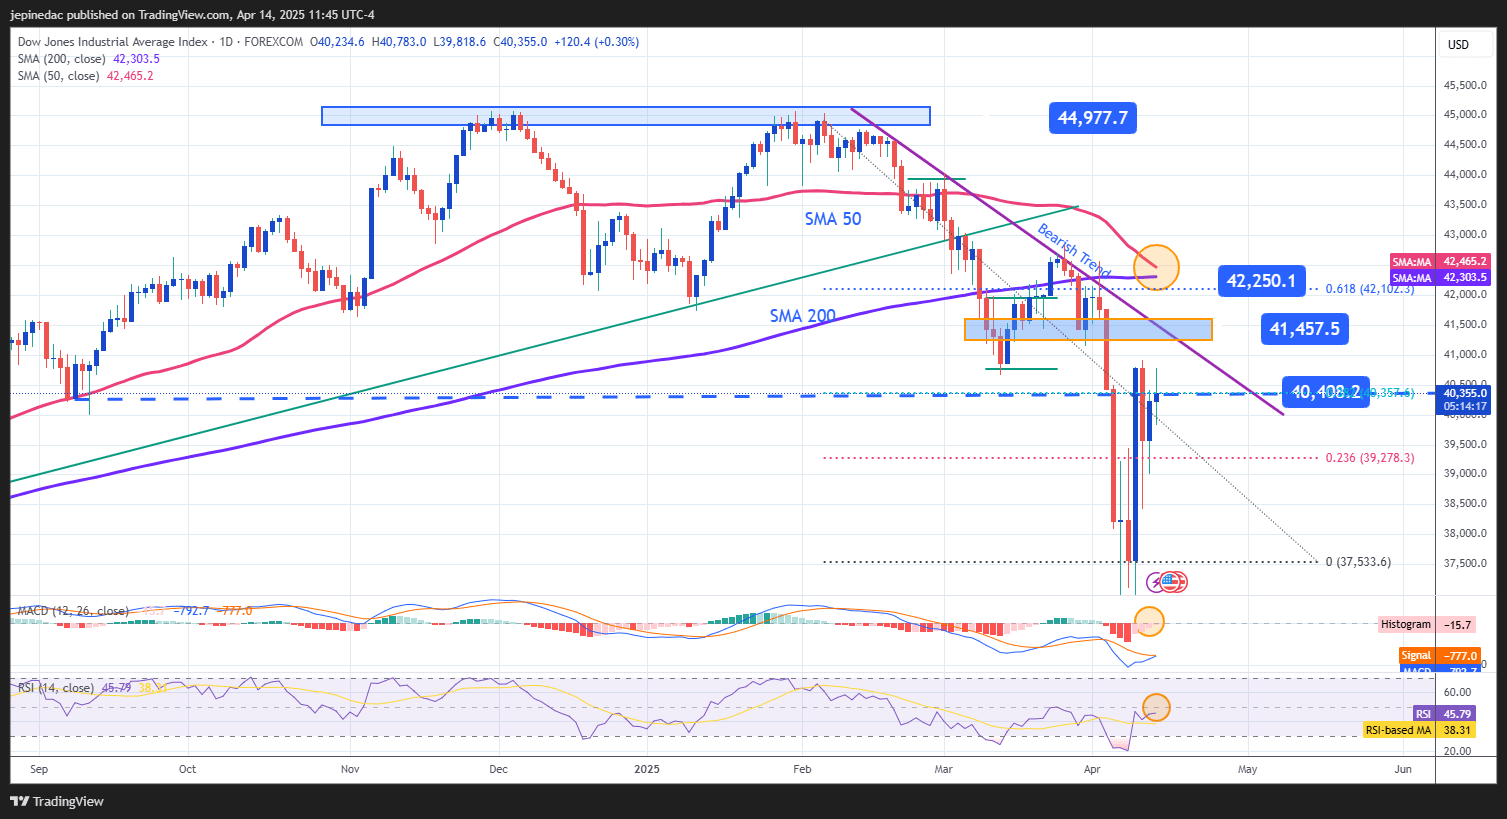
Source: StoneX, Tradingview
- Downtrend Holds: Since mid-February, the Dow Jones has been in a steady downtrend, and recent bullish swings have not been strong enough to break this pattern. Increased volatility in recent sessions has pushed the price into neutral zones, with no clear directional bias. For now, the downtrend line remains the key technical structure to monitor.
- Possible Death Cross: The 50-day moving average maintains a downward slope and is gradually approaching the 200-day moving average. A potential bearish crossover between the two could trigger the classic “death cross” signal, reinforcing a stronger selling bias.
- Neutrality in Technical Indicators:
- MACD: The MACD histogram is oscillating near the zero line, indicating neutral momentum in the strength of recent moving averages.
- RSI: The RSI also shows neutral behavior, hovering near the 50 level, reflecting a balance between buying and selling pressure.
Both indicators reinforce the current lack of clear direction in the Dow Jones, suggesting a period of stabilization in the short term.
Key Levels:
- MACD: The MACD histogram is oscillating near the zero line, indicating neutral momentum in the strength of recent moving averages.
- 40,400 pts – Key Support: This level aligns with a zone of neutrality seen in September 2024. A breakdown below this level could reaffirm the current downtrend.
- 41,450 pts – Near Resistance: This zone corresponds to previous neutral levels and the downtrend line. It may serve as a temporary pause zone for bullish attempts.
- 42,250 pts – Major Resistance: This level coincides with both the 50- and 200-day moving averages as well as the 61.8% Fibonacci retracement. A breakout here could invalidate the current bearish structure and trigger a new bullish trend.
Written by Julian Pineda, CFA – Market Analyst
Latest market news

May 26, 2023 01:10 PM

April 10, 2023 08:30 PM

September 9, 2022 02:52 AM

August 3, 2022 07:55 PM