

View related analysis:
- 2025 could be one heck of a ride if bearish AUD/JPY clues are correct
- AUD/USD Weekly Outlook: Trimmed Mean Inflation in Focus
- Japanese Yen (JPY) Sentiment Could Be at an Extreme: COT Report
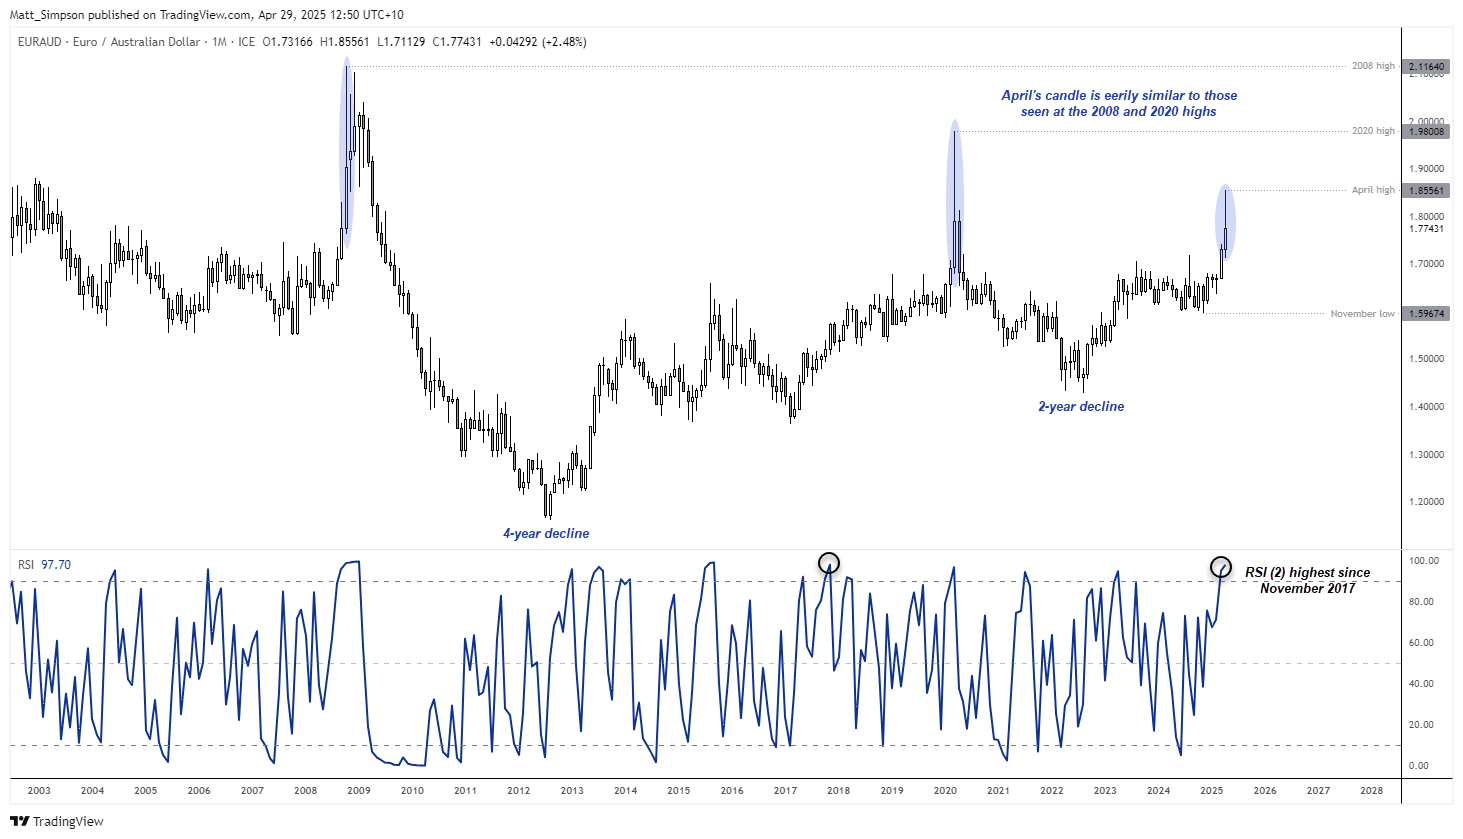
EUR/AUD Technical Analysis: Euro vs Australian Dollar (Monthly Chart)
The rally from the November low has been nothing short of impressive, with EUR/AUD rising over 16% by the April high. What makes it particularly interesting is how the second and third rallies increased in velocity with each wave. But perhaps bulls have had too much of a good thing, and we’ve already seen the best part of the move.
If we zoom out on the monthly chart, the current candle for April is eerily similar to the March 2020 high and October 2008. The former resulted in a two-year decline, the latter a four-year decline. With less than two trading days left in the month, it seems likely EUR/AUD will have handed back over half of its early-month gains, just as it did in 2020 and 2008. Note that the monthly RSI (2) is also at its most overbought level since November 2017.
The monthly candlestick chart is not a timeframe for most to toy around with, but it is something to consider as we enter May. Besides, EUR/AUD could be due another bounce higher over the near term, even if I doubt its ability to retest that April high in a hurry.

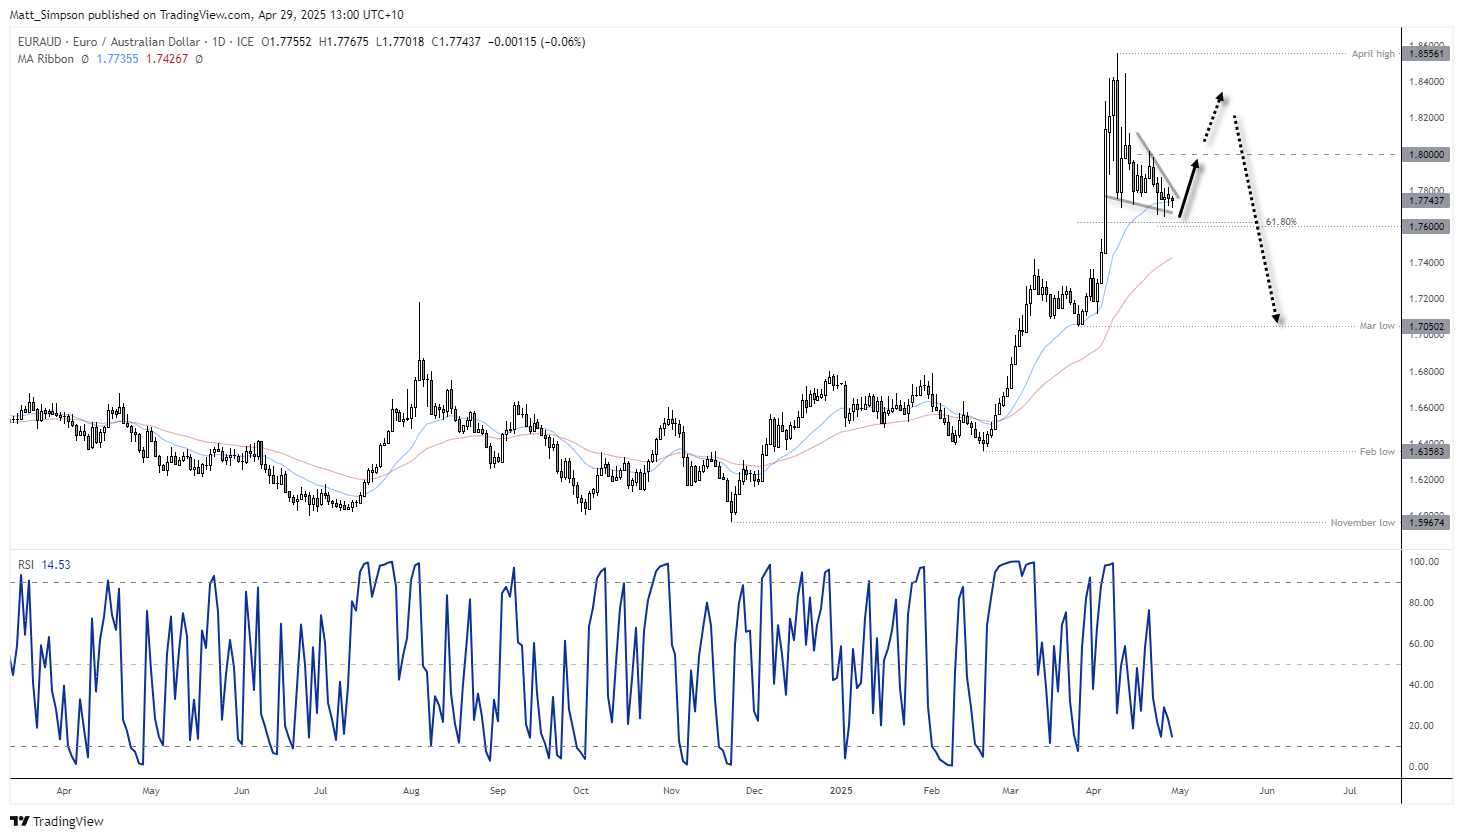
EUR/AUD Technical Analysis: Daily Chart
The daily chart shows that EUR/AUD has been retracing lower since the April high. However, momentum behind the decline is fading, allowing a falling wedge pattern to form — typically a bullish reversal signal within downtrends.
While projecting a target based on the base of the wedge is ambiguous in this case, a conservative target near the 1.80 handle aligns with recent price structures. We can reassess the target as price action unfolds.
Prices are attempting to hold above the 20-day EMA, with a bullish hammer and doji candle highlighting two recent failed attempts to break lower. Additionally, lows are holding above both a 361.8% Fibonacci extension and the 1.76 support level.
EUR/USD: Key Near-Term Technical Points
- The near-term bias favours a bounce towards 1.80.
- Bulls may seek dips toward the 1.76 handle, using a break below it as an invalidation of the bullish setup.
- Given price action signals on the monthly chart, I will seek evidence of a lower swing high beneath April’s peak — under the assumption that bulls have already captured the majority of the upside move, and that a deeper correction could follow.
-- Written by Matt Simpson
Follow Matt on Twitter @cLeverEdge
Latest market news
September 18, 2025 02:48 PM
June 23, 2025 01:22 PM
June 23, 2025 10:39 AM
June 20, 2025 05:23 PM
June 20, 2025 04:46 PM
June 20, 2025 03:35 PM

June 20, 2025 04:46 PM

June 20, 2025 03:35 PM

June 20, 2025 02:18 PM

June 20, 2025 12:21 PM