

EUR/USD Talking Points:
- The strength from Q3 has been mostly erased so far in Q4, with a fast sell-off developing in EUR/USD.
- In late-September the pair continued to grind away at the 1.1200 handle but not even a month later the pair has dropped by more than four big figures.
- Support showed up at the 1.0765 level looked at in yesterday’s webinar. The big question now is whether that can lead to some profit taking from sellers, which could build a bounce and that can remain of interest for bears looking for lower-highs.
EUR/USD has now traded lower for 17 of the past 19 days. An amazing trend by any stretch but perhaps even more so when compared to the strength that showed in the pair during the first two months of Q3. While that prior bullish trend put in a month of grind at the 1.1200 level, eventually failing, the bear move that’s come in response has been fast and heavy. There’s been only a minimum of pullback so far and any excuse for sellers to continue pushing has so far contributed to continuation.
Last Friday brought a bit of bounce. That went along with a pullback in the USD from the 200-day moving average. But support soon showed at a key zone in DXY and bulls were off to the races (and bears in EUR/USD) after this week’s open.
In EUR/USD, that resistance earlier in the week played-in right off the underside of the 200-day moving average.
At this point the challenge is chasing an oversold trend as RSI on the daily remains in oversold territory on EUR/USD. There has been a bounce showing thus far at the level looked at in yesterday’s webinar around 1.0765. That price is the 38.2% Fibonacci retracement of last year’s sell-off, and its confluent with a trendline originating from last year’s low.
EUR/USD Daily Price Chart
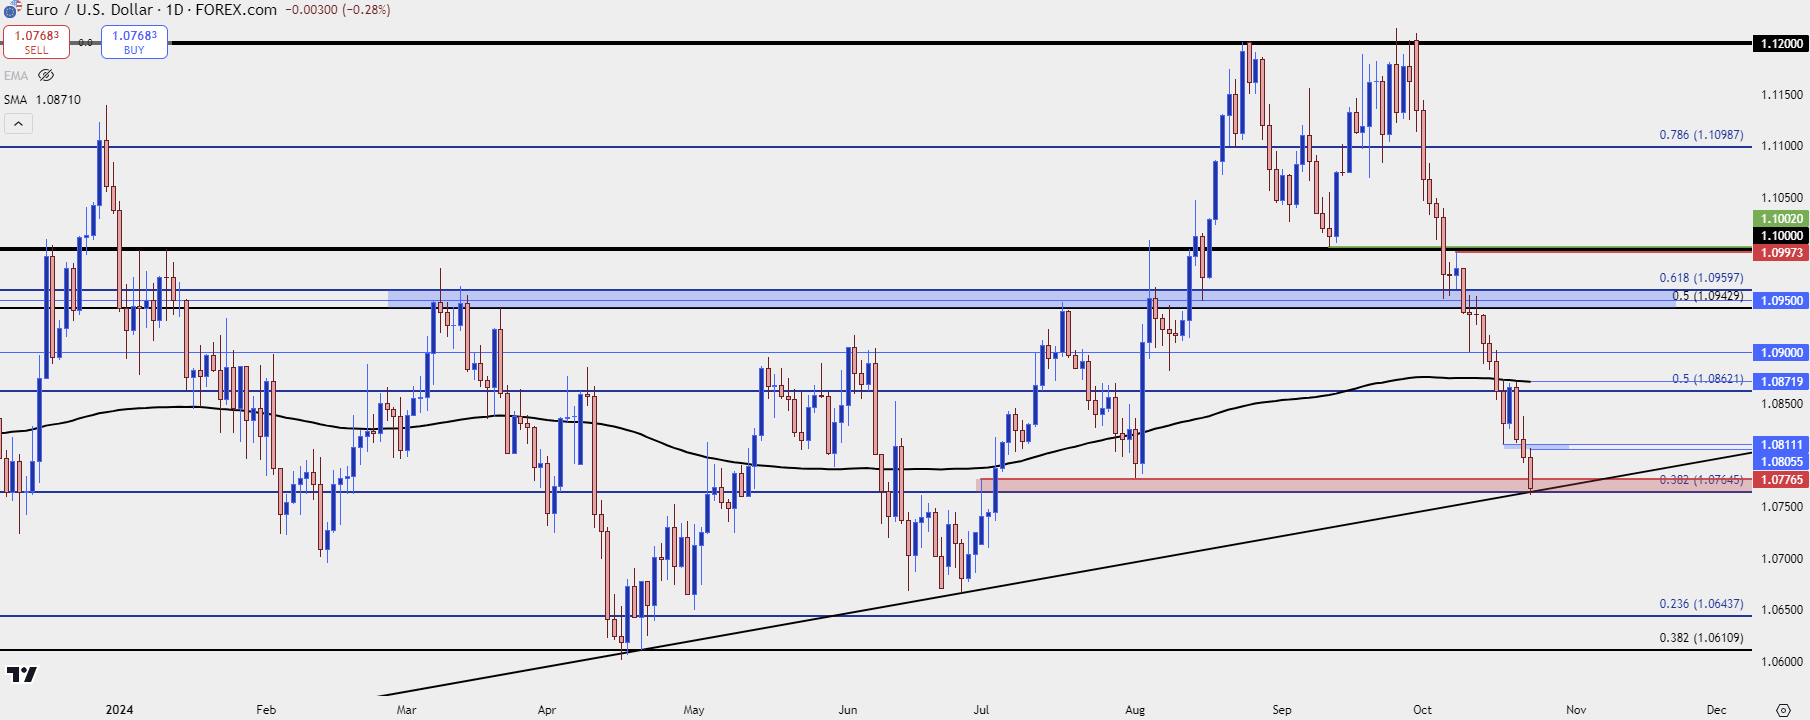 Chart prepared by James Stanley, EUR/USD on Tradingview
EUR/USD Longer-Term
Just as I was saying in September when strength was all the range, EUR/USD remains in a range that’s been in-play since last year’s open. There have certainly been some clean shorter-term trends in the confines of that ranging backdrop, and we’ve made a fast move towards the support side of that range but if we do see sellers continuing to push, those values could soon come into play.
The current 2024 low plots around the 1.0611 Fibonacci level, which is the 38.2% retracement of the 2021-2022 major move. On the below weekly chart, I’ve linked that level to the shorter-term Fibonacci level at 1.0643 to create the next support zone, down.
Below that, it’s the 1.0500 level that put up considerable fight for about a month before leading to a turn a year ago.
EUR/USD Weekly Price Chart
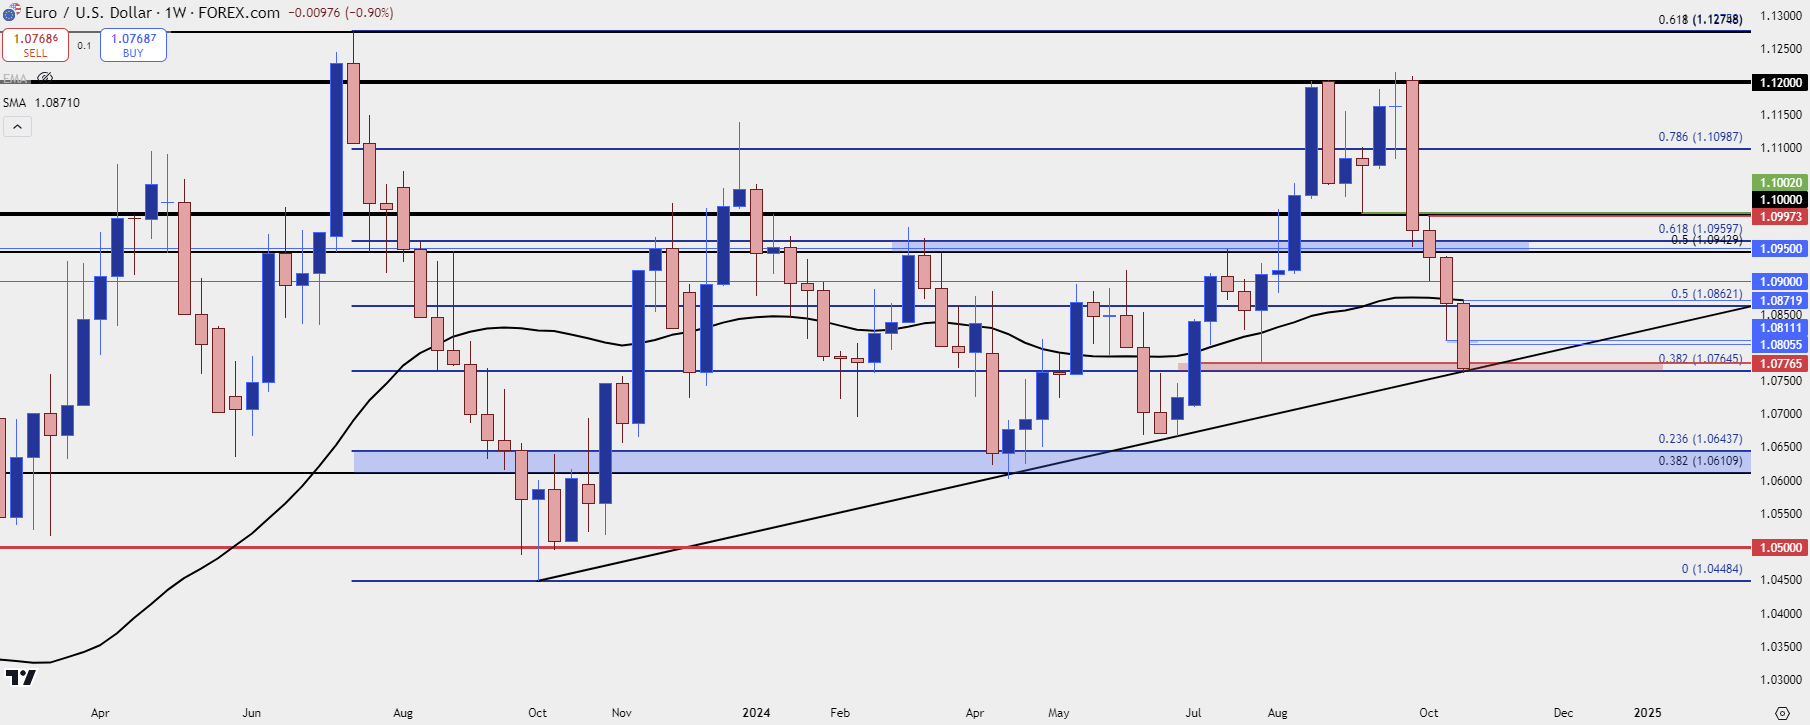 Chart prepared by James Stanley, EUR/USD on Tradingview
--- written by James Stanley, Senior Strategist
Latest market news
September 18, 2025 02:48 PM
June 23, 2025 01:22 PM
June 23, 2025 10:39 AM
June 20, 2025 05:23 PM
June 20, 2025 04:46 PM
June 20, 2025 03:35 PM

June 9, 2025 03:52 PM

June 6, 2025 05:41 PM

May 21, 2025 07:02 PM

May 20, 2025 06:58 PM