

Euro, EUR/USD Talking Points:
- EUR/USD was in a consistent sell-off through the first three days of the week with the pair putting in a six-day streak of losses. And then the 200-day moving average came into play and brought a bounce into the end of the week.
- The bullish trend that broke out in March deserves some respect as it showed after two consecutive months of indecision in January and February. But the 1.1000 handle is an imposing level and the 1.0943 Fibonacci level that held the highs twice in March kept bulls at bay for now.
- I go over both the USD and EUR/USD in-depth in each weekly webinar, and you’re welcome to join the next. Click here for registration information.
If we take a step back, it’s been a strong quarter for EUR/USD, the second strongest in the past seven years, as a matter of fact, with the pair currently showing a +4.5% gain for Q1.
And that stands in stark contrast to the consistent sell-off that drove the pair in Q4 of last year. But sellers were stymied in January as the monthly bar printed a doji, and then another doji appeared in February further highlighting that stall from sellers.
It was the March open when matters began to shift as an explosive breakout took over in the pair and EUR/USD quickly jumped more than four big figures in a short period of time, with the 1.0943 Fibonacci level eventually coming in to hold the highs.
EUR/USD Monthly Price Chart
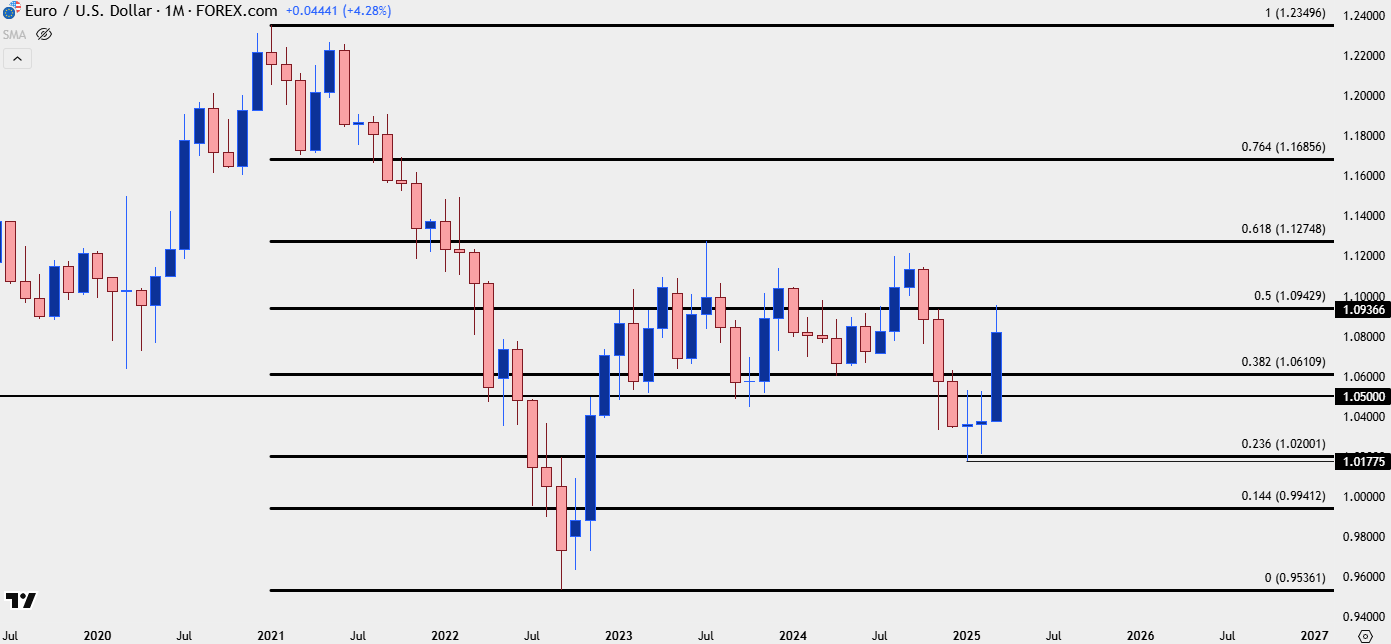 Chart prepared by James Stanley; data derived from Tradingview
EUR/USD March into Resistance
That 1.0943 level was a tough spot for Euro bulls. It held the highs over two separate tests, including on the Tuesday before the FOMC rate decision. As I had shared in the pre-FOMC price action webinar, there was building potential for a turn in the pair, supported by the diverging RSI on the daily chart to go along with the stalling at that resistance.
That then led into six consecutive red daily candles on the daily chart of EUR/USD, in a trend that looked very consistent from shorter time frames. But, as I shared in this Tuesday’s webinar, the 200-day moving average represented a massive spot of possible support, and that has so far lived up to its billing.
The current weekly bar is showing as a doji after that 200-day moving average helped to lead to a bounce, and given where this has printed, after two consecutive weeks of resistance at 1.0943, the door would be open for bulls to make a greater push as the Q2 open nears next week.

EUR/USD Weekly Chart
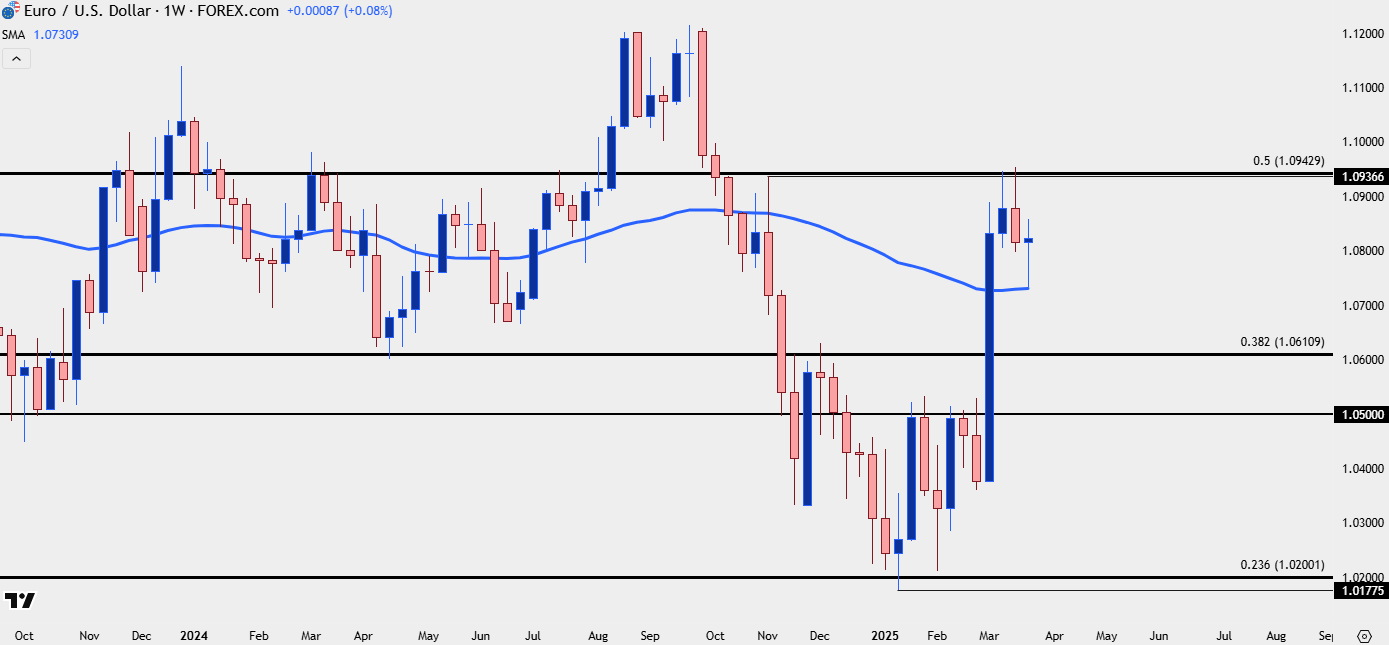 Chart prepared by James Stanley; data derived from Tradingview
EUR/USD: A Tale of Two Trends
As shared in the above video, I want to look at this from the perspective of two trends. The broader trend I’d classify as bullish after the strong breakout at the March open; while the shorter-term trend would be bearish after that consistent pattern of red days that led into the 200-day moving average test.
In both perspectives, the 1.0611 level is the next major level down as this is the 38.2% Fibonacci retracement of the same setup that caught the highs twice in March at the 50% marker. So, if we do see that shorter-term trend continue, 1.0611 could still represent a jumping off point for bulls to continue the broader move.
Shorter-term, a resistance level at 1.0861 remains as a big spot, and that’s confluent with a Fibonacci level at 1.0865; so that would represent the spot that bulls need to beat to start negating that shorter-term trend. If that happens, the door opens to re-tests of 1.0909, 1.0943 and perhaps even the first re-test of the 1.1000 psychological level since the Q4 reversal took over.
If we do see that big figure tested soon, I’m not expecting an easy break; and this is likely why a pullback to 1.0611 would be an optimal backdrop for bigger picture bullish trend potential.
EUR/USD Daily Price Chart
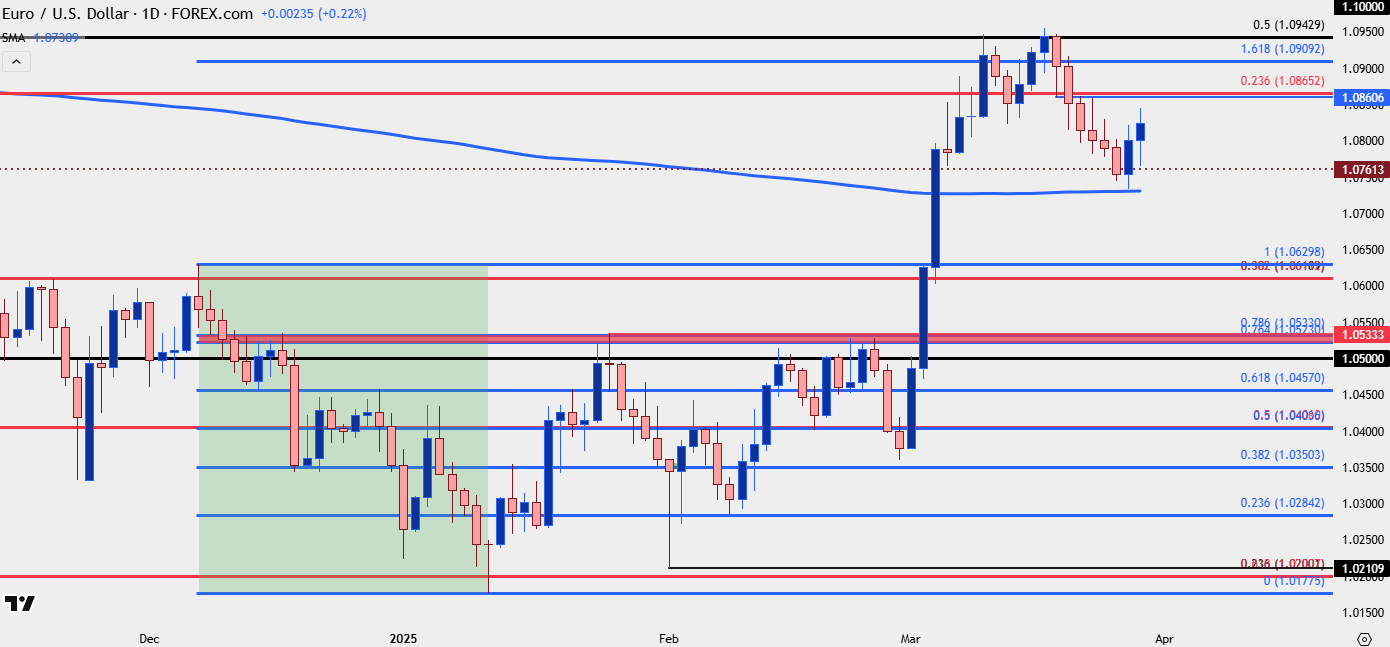 Chart prepared by James Stanley; data derived from Tradingview
--- written by James Stanley, Senior Strategist
Latest market news
September 18, 2025 02:48 PM
June 23, 2025 01:22 PM
June 23, 2025 10:39 AM
June 20, 2025 05:23 PM
June 20, 2025 04:46 PM
June 20, 2025 03:35 PM

June 20, 2025 04:46 PM

June 18, 2025 07:38 PM

June 18, 2025 03:31 PM

June 17, 2025 06:24 PM