

Euro, EUR/USD Talking Points:
- US Dollar weakness has continued and EUR/USD has pushed up to a fresh weekly high after breaking above the 1.1275 level.
- The big question now is whether bulls can continue to hold control for tests of 1.1402 and then the major psychological level at 1.1500.

US Dollar bulls are on their back foot and as I said in yesterday’s webinar, it feels like USD/JPY is doing a lot of the driving. With Japanese bond yields jumping last night on the back of a poor auction of long dated debt, USD-weakness has gotten another shot in the arm and USD/JPY is now working on its seventh consecutive down day.
While JPY is only 13.6% of the DXY quote, the carry trade that build through 2021 and 2022 has helped the pair to remain about 40% above its opening 2021 values. So, logically, as Japanese yields rise and carry trades unwind, that can create a force of USD-weakness elsewhere, EUR/USD included.
This would be like the backdrop that showed last Q3, when EUR/USD rallied up to the 1.1200 handle even despite a dovish ECB and a soft backdrop for European growth. That episode reversed aggressively, of course in Q4, but at this stage it seems as though another episode of worry around Yen carry unwind is before us, and that’s helping to prod another rally in EUR/USD, very similar to what showed in April as the pair tested the 1.1500 handle.
The big question now is whether that can continue. If we do see USD/JPY ultimately break the 140.00 handle, I think that it can, but that remains a giant question mark as that big figure led to strong bounces both last year in Q3 and then again in April, both episodes that helped to prod a visible rally in the USD.
For EUR/USD, it’s the 1.1500 level that looms large at current, as that was the price where the music stopped for EUR/USD bears back in April, with a 400+ pip retracement following into last week’s low.
EUR/USD Weekly Chart
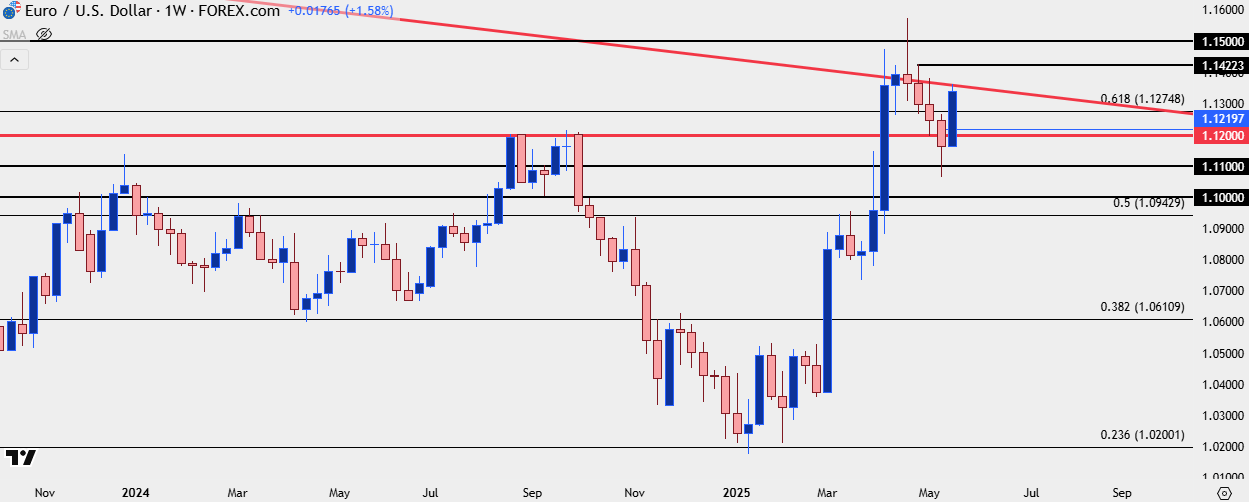 Chart prepared by James Stanley; data derived from Tradingview
EUR/USD Strategy
While I still do contend that USD/CAD could be a more amenable backdrop for USD bearish scenarios, the beauty of price action is that there’s a degree of objectivity that’s afforded. And like I talked about in yesterday’s webinar, that objectivity will be governed by the timeframes being followed. At the time, EUR/USD had continued to hold resistance at a major spot on the chart, from the 1.1275 handle. There was a shorter-term build of higher-lows but as of that webinar, bulls hadn’t taken the important step of forcing a higher-high yet.
That has since delivered and we now have the higher-high on the four-hour chart, setting the stage for bullish continuation potential. Prior resistance in that 1.1275 zone is now support potential,
From the four hour chart below we can see upper wicks showing on the past two bars with respect to resistance at prior support of 1.1330. This isn’t to say that the move can’t extend, but with next resistance at the Fibonacci level of 1.1402, it may be a more attractive path forward to wait for a pullback, looking to the 1.1264-1.1275 zone, or perhaps the prior swing high at 1.1293; looking for some element of higher low support so that risk outlay can be concentrated before pushing bullish continuation themes.
If bulls can push up to 1.1402, the next major spot overhead is that same 1.1500 psychological level. While there’s already been some testing above that price, the next test could similarly lead to some resistance, so breakout strategies should be pushed with caution given where on the chart this is all taking place.
EUR/USD Four-Hour Chart
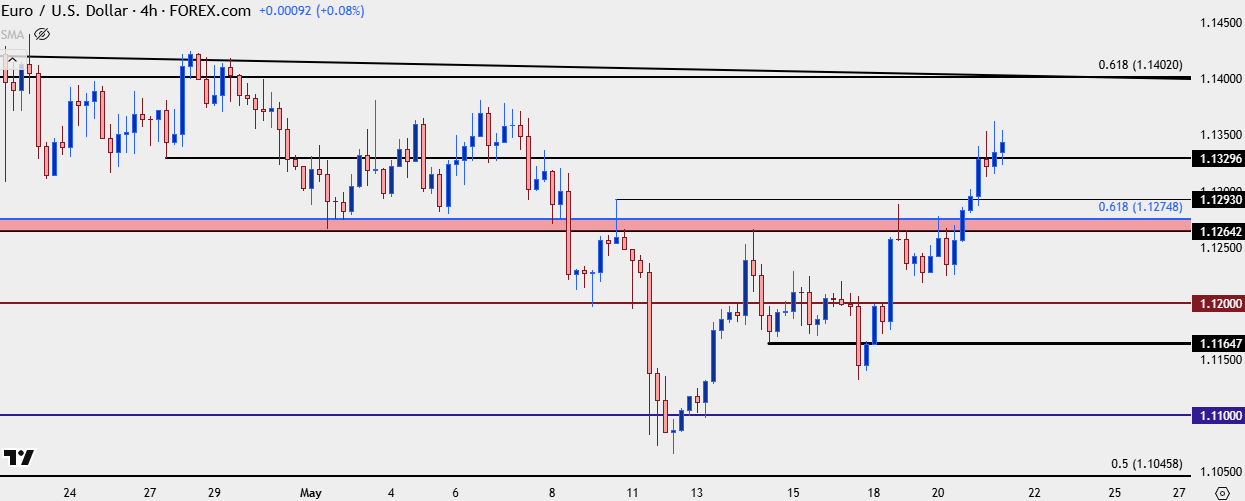 Chart prepared by James Stanley; data derived from Tradingview
--- written by James Stanley, Senior Strategist
Latest market news
September 18, 2025 02:48 PM
June 23, 2025 01:22 PM
June 23, 2025 10:39 AM
June 20, 2025 05:23 PM
June 20, 2025 04:46 PM
June 20, 2025 03:35 PM

June 20, 2025 04:46 PM

June 20, 2025 03:35 PM

June 20, 2025 02:18 PM

June 20, 2025 12:21 PM