

Euro, EUR/USD Talking Points:
- EUR/USD came into the year in a very bearish position but that changed after two months of indecision in January and February.
- The bullish trend in March and April was unable to drive above the 1.1500 handle, and the month of May has shown a lower-high at 1.1400, with the monthly bar currently displaying as a doji.
- I look at EUR/USD in-depth in each weekly webinar and you’re welcome to attend the next. Click here to register.

Coming into the year it seemed as though parity calls for EUR/USD were all over the place. The pair had just put in a strong reversal in Q4 as EUR/USD drove down to a fresh two-year low, and that accompanied a massive bullish push on the USD as the currency showed one of its strongest quarterly gains in years.
But January started to show a change of pace and that weas illustrated well on the monthly chart as a doji built for the month following a support test at the 1.0200 level. And then another doji appeared in February, and this time, a higher-low had shown up as sellers weren’t even able to stretch down for a re-test of the 1.0200 level.
By the time we got to March, bears didn’t seem so confident about that parity test, any longer, and a strong reversal then showed up as EUR/USD put in one of its strongest breakouts ever. That strength held through April trade, as the pair re-tested the 1.1500 level for the first time since the 2022 sell-off showed up.
But the month of May has presented another item of change as a bit of indecision has appeared. A rule of thumb for a doji is that you generally want to see the candle’s body as 5% of the total range, or less. As I write this with a couple hours left for the monthly bar to complete, that criteria is not quite met. But, that would simply mean that the candle takes on more of a ‘spinning top’ element than a doji, which would still illustrate a degree of indecision, coupled with a lower-high for the month.
EUR/USD Monthly Chart
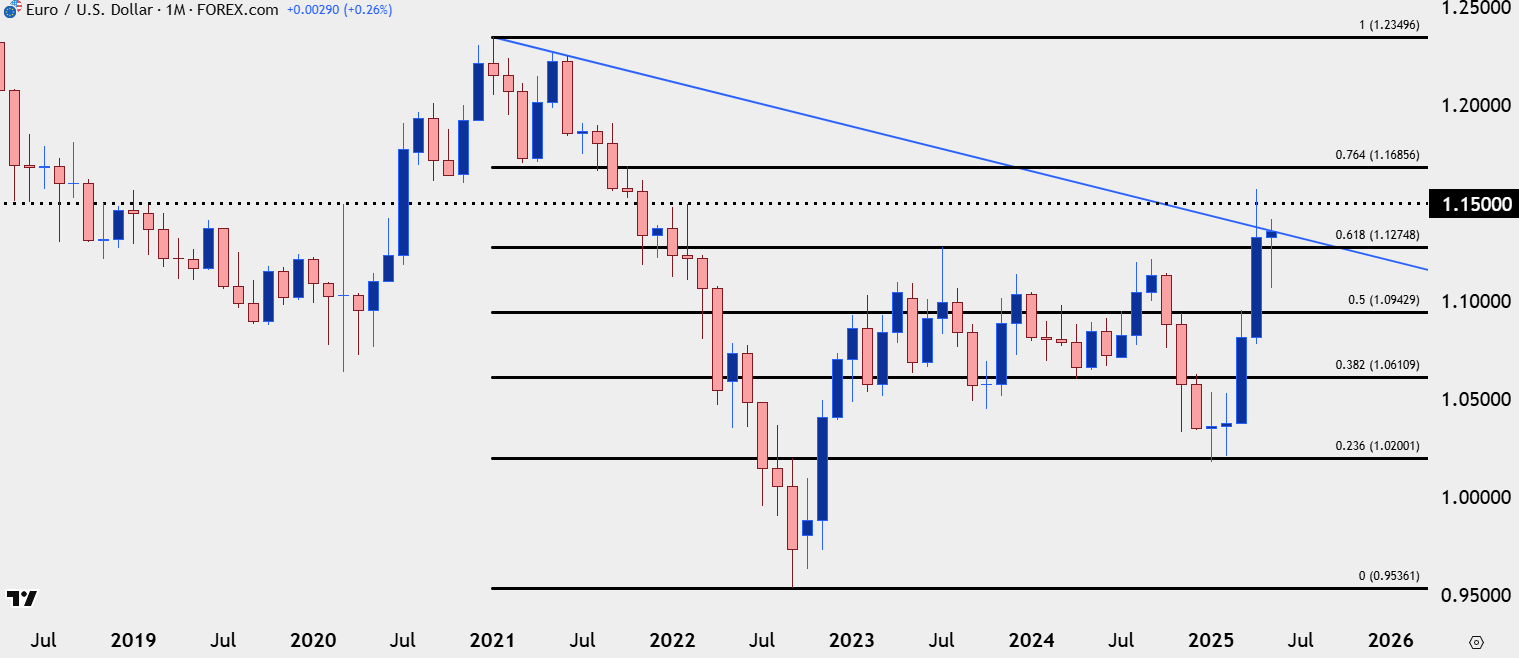 Chart prepared by James Stanley; data derived from Tradingview
EUR/USD Daily
I remain of the opinion that EUR/USD is one of the more attractive major FX pairs for USD-strength scenarios. While EUR/USD continued to hold a lower-high at the 1.1400 handle, other pairs, such as USD/CAD or GBP/USD, have been able to drive to fresh 2025 lows/highs; and if we do see USD bears continuing to push, I like the backdrop in both of those pairs better.
For EUR/USD, price action has narrowed into a symmetrical triangle, which offers some additional definition behind this month’s indecision.
For support, a break of 1.1200 shows sellers taking control, and 1.1275 is a shorter-term level of importance that showed as support last week. Below those, 1.1100 looms large as this is what helped to mark the May low, and if sellers can elicit a break below that, 1.1000 and then 1.0943 loom large.
For resistance, 1.1400 is followed by the 1.1500 handle but if we see those trade, I think there may be cleaner trends elsewhere in GBP/USD or USD/CAD, as discussed in last week’s webinar.
EUR/USD Daily Chart
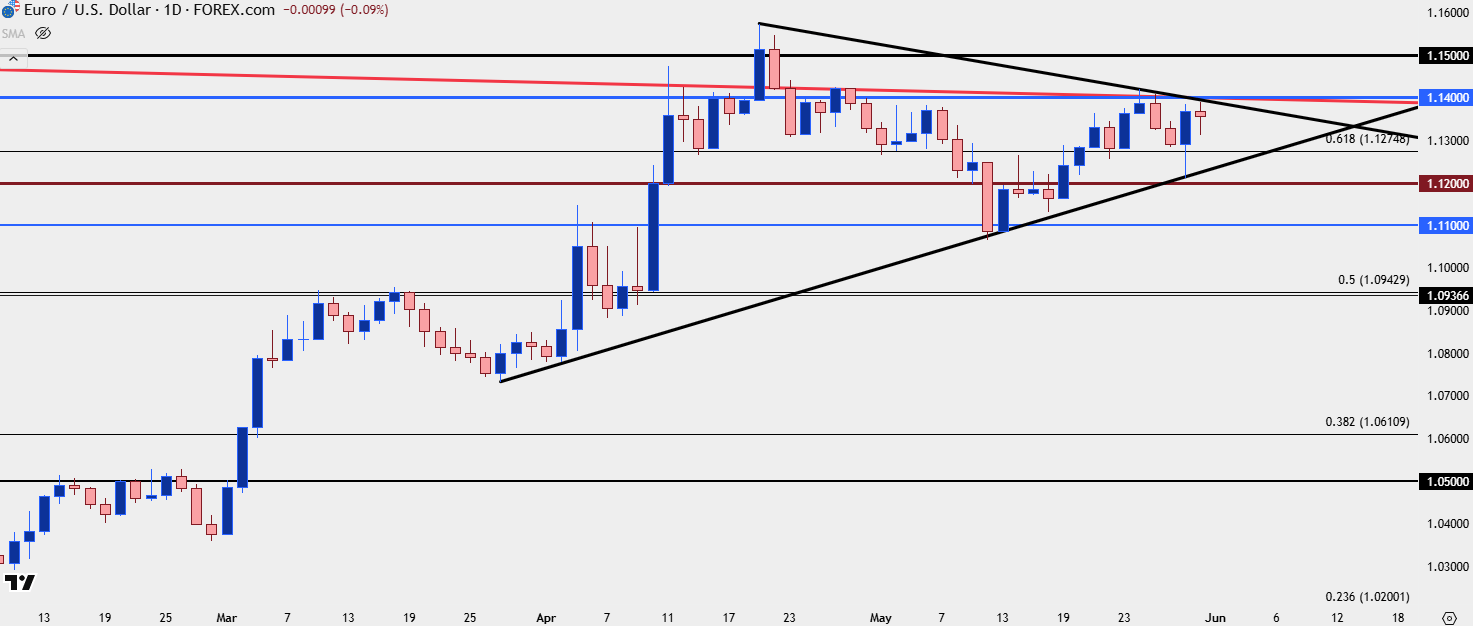 Chart prepared by James Stanley; data derived from Tradingview
--- written by James Stanley, Senior Strategist
Latest market news
September 18, 2025 02:48 PM
June 23, 2025 01:22 PM
June 23, 2025 10:39 AM
June 20, 2025 05:23 PM
June 20, 2025 04:46 PM
June 20, 2025 03:35 PM

June 13, 2025 06:22 PM

June 10, 2025 03:17 PM

June 10, 2025 11:00 AM

June 9, 2025 08:05 PM