

Euro Talking Points:
- EUR/USD has so far shown indecision this week, but the Euro was weak against both JPY and GBP as the European Central Bank appeared dovish at the Thursday rate cut.
- EUR/USD has seen the weekly chart go into overbought territory and that meshes with an oversold reading on the USD. But, to date, EUR/USD bears haven’t been able to take over as the 1.1275 level has held higher-low support so far.
- It’s been an abnormally volatile backdrop in EUR/GBP over the past few weeks and EUR/JPY once again held resistance at the 163.00 level, which has happened for the past five weeks.

It’s been a strong start to the year so far for EUR/USD, and this comes despite the European Central Bank being somewhat dovish. Thursday saw the bank cut rates yet again and this time, they removed a phrase from the statement about rates being in ‘restrictive’ territory which was deductively read to mean that they’re getting more and more dovish.
There was also some bullish context for the USD: Jerome Powell sounded hawkish in his speech on Wednesday, reiterating fears around inflationary pressure from tariffs and continuing to highlight a ‘wait and see’ mode. This followed a strong retail sales report out of the U.S. and even from a technical perspective, the weekly chart of USD went into oversold conditions for only the second time in the past seven years. But USD bulls couldn’t pounce and correspondingly, EUR/USD bears didn’t show much for weakness beyond the support test at 1.1275.
I spoke about this at-length in the USD video for this week along with some scenarios that I’m tracking. It can take time for these longer-term overbought or oversold conditions to rectify so just because it hasn’t happened yet does not mean that it won’t. But, with that said, deduction is important and if a market doesn’t respond with strength in the face of seemingly strong drivers, there might be a reason for it and traders should take heed of that message.
USD Video for the Week Ahead
EUR/USD Daily
From the daily chart it’s the 1.1400 level that bulls haven’t been able to leave behind, although I believe it’s the 1.1500 level that hasn’t yet come into play that’s probably even more impactful. That price was last in-play in early-2022 and it held resistance over a few different iterations before sellers were ultimately able to take over, and that drove a significant trend that eventually pitched below parity.
In this instance, prices were breaking out aggressively a week ago and buyers suddenly stalled just 26 pips below that big figure. The Monday open showed a lower-high, and then sellers tried their hand at a pullback but couldn’t make it below the 1.1275 level, and this highlights a couple of key Fibonacci retracements.
In blue below, I have the 2021-2022 major move and in black, the 2018-2022 major move is marked. Both have had some nearby inflections and notably, it was the same 1.1275 level that held the highs back in 2023 and then came in this week as the weekly low.
The prospect of resistance at 1.1500 could continue to constrain the move and that keeps the door open for a deeper pullback; but given structure, it would be difficult to forecast a bigger picture reversal or a failure from bulls until the 1.0900-1.0943 zone is taken out, as that was the last higher-low before the breakout.
Between the 1.1275 level that that zone exists a few different areas of possible resistance, such as the 1.1200 level that was a brick wall last year, or perhaps even the 1.1100 level that held the highs earlier in April.
EUR/USD Daily Chart
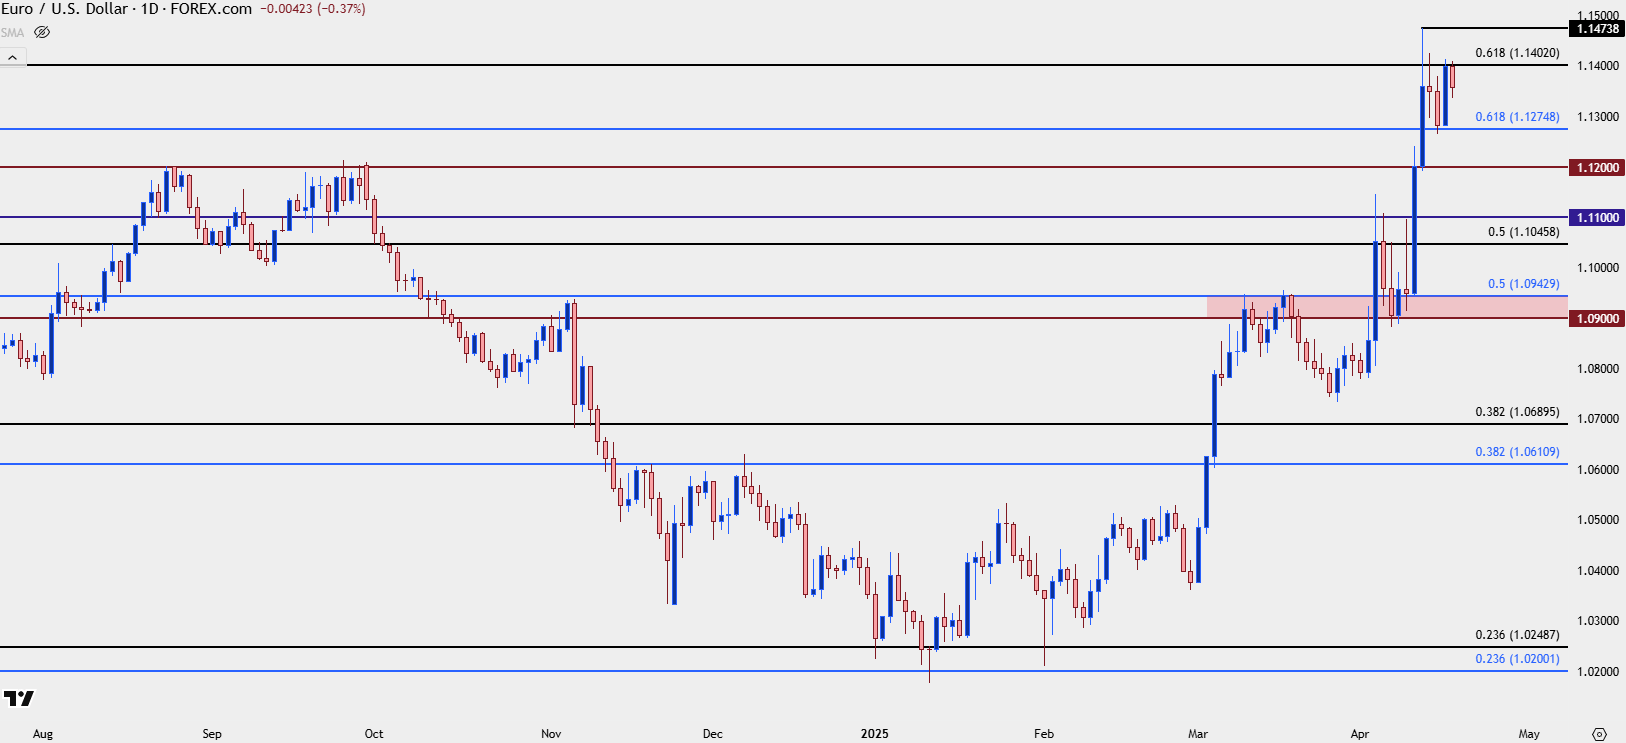 Chart prepared by James Stanley; data derived from Tradingview
EUR/USD Weekly
The weekly chart is what I think remains important here and at this point, the weekly bar has built a doji illustrating indecision. That also shows both a lower-high and a higher-low, indicative of digestion after a large move. The overbought RSI combined with prices holding very near longer-term range resistance keeps the prospect of mean reversion as an attractive backdrop in EUR/USD on a bigger picture basis.
EUR/USD Weekly Chart
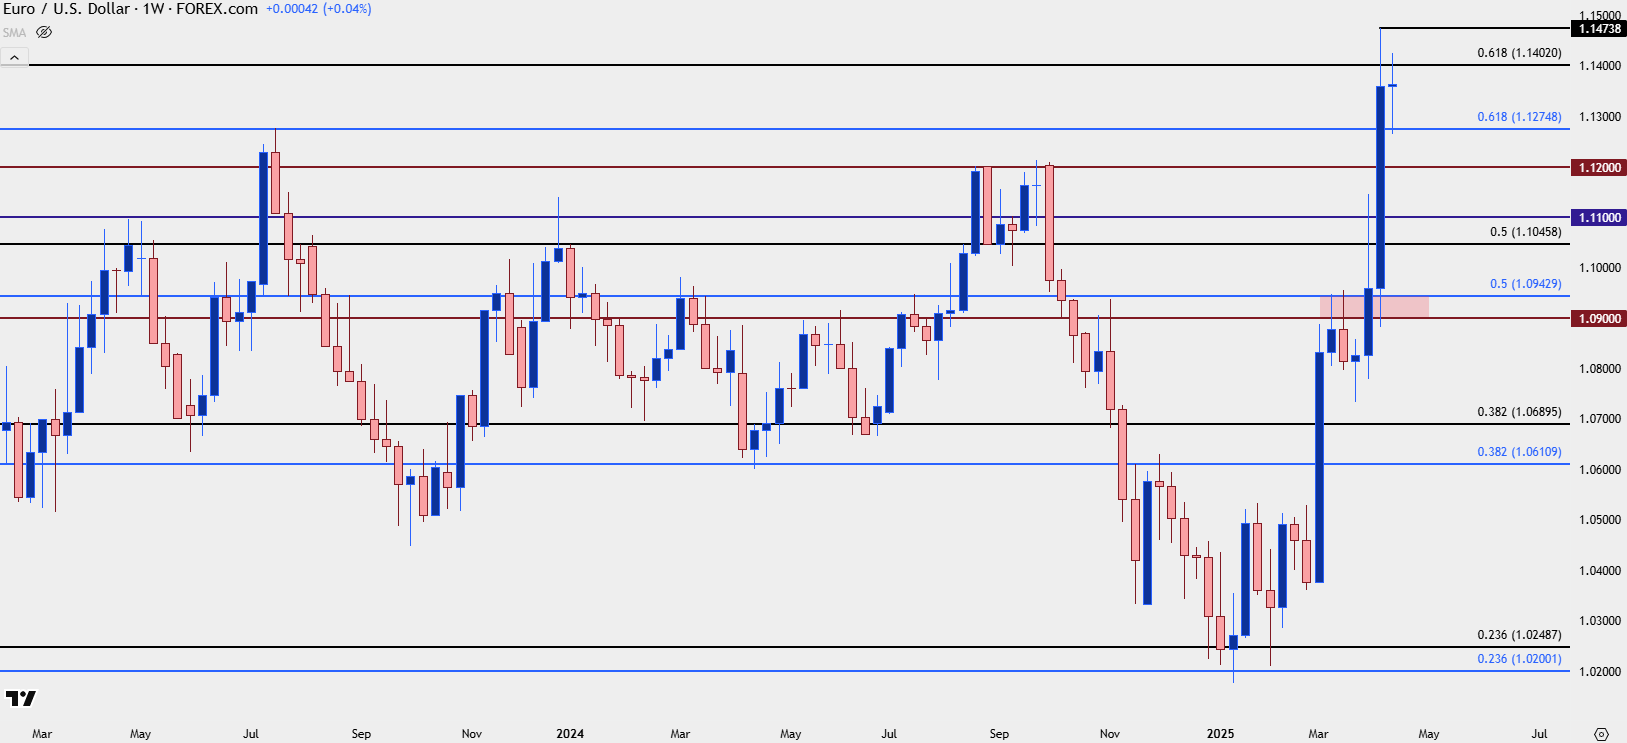 Chart prepared by James Stanley; data derived from Tradingview
EUR/JPY
EUR/JPY had some strong trending backdrop from the 2022 low as the carry trade pushed in 2022 and 2023 with the pair eventually setting fresh all-time-highs. But as the carry trade started to shake in July of last year, so did EUR/JPY, quickly putting in a 38.2% Fibonacci retracement of the 2022-2024 major move.
Support held around that level with an assist from the 155.00 psychological level just below that: but ever since then it’s largely been a game of digestion in the pair with neither side of the move showing the ability to take over.
EUR/JPY Monthly Chart
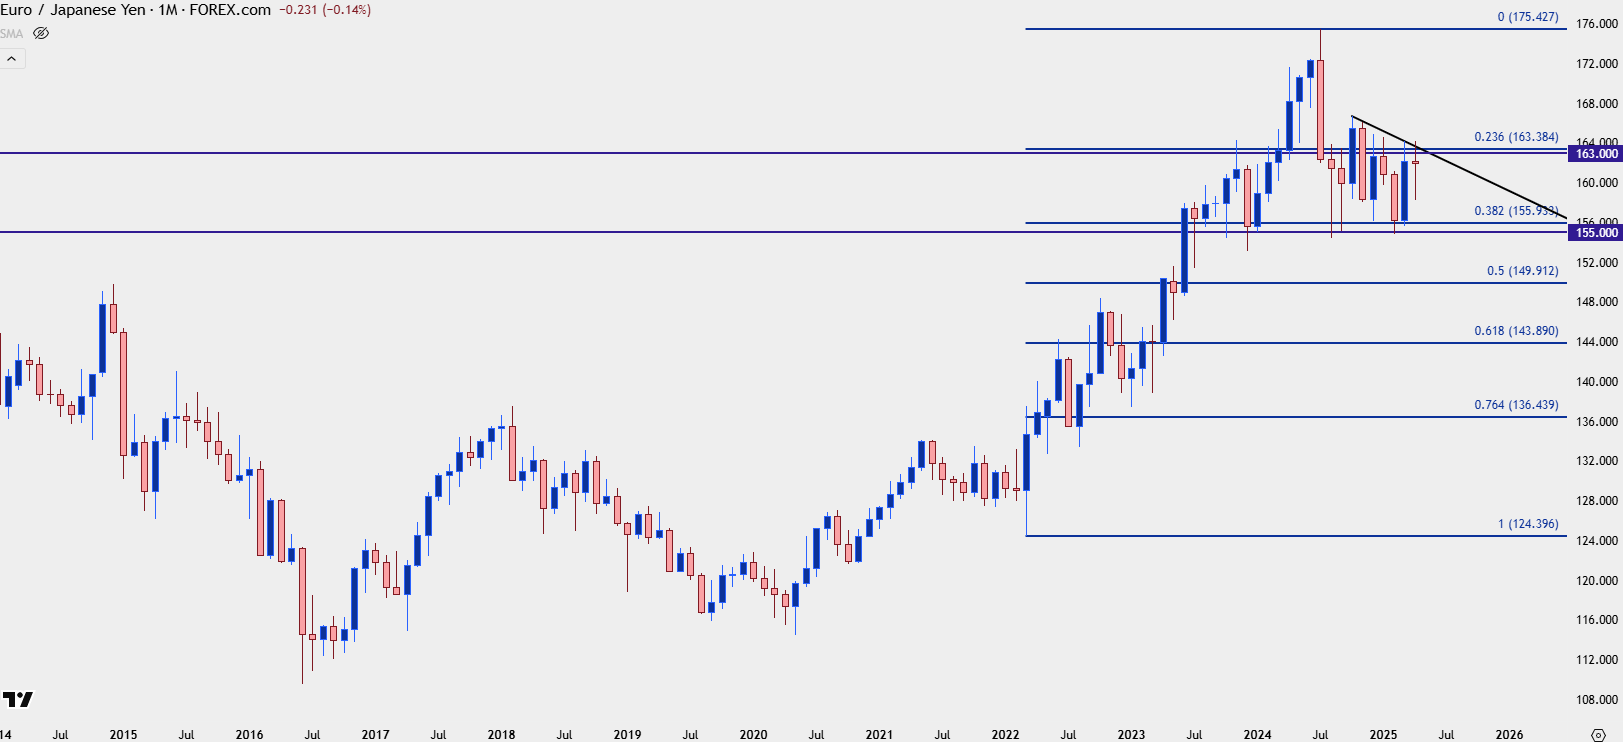 Chart prepared by James Stanley; data derived from Tradingview
EUR/JPY Weekly
That digestion shows as a descending triangle on the weekly chart, with multiple tests of the 155-155.93 zone to go along with lower-highs over the past six months. More recently, it’s the 23.6% retracement spanned down to 163.00 that’s been helping to hold the highs.
Notably, that zone has traded and held as resistance for each of the past five weeks.
EUR/JPY Weekly Chart
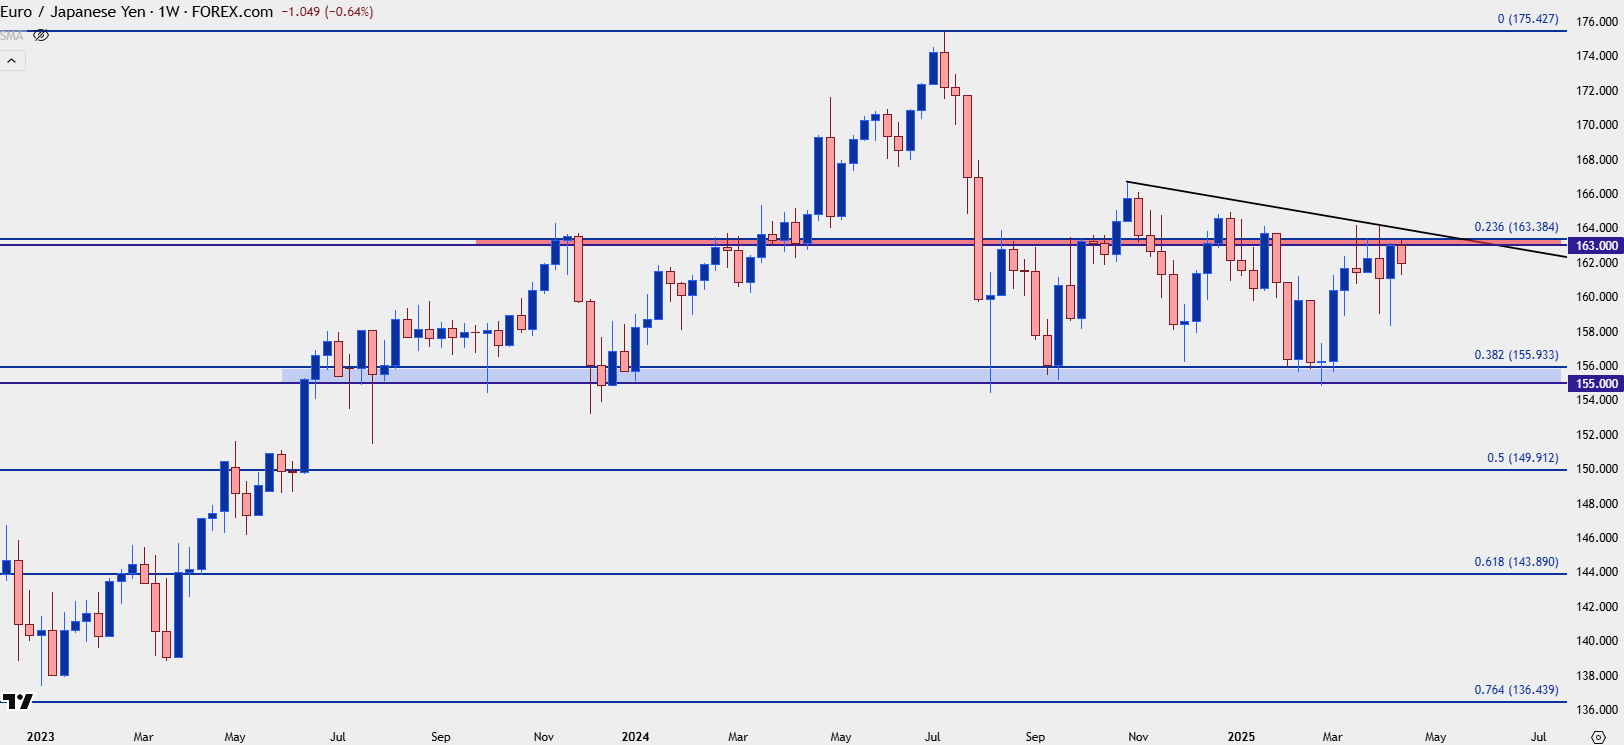 Chart prepared by James Stanley; data derived from Tradingview
EUR/JPY Daily
The daily chart of EUR/JPY is messy as there’s been quite a few sharp intra-day reversals of late, illustrated by the extended wicks, particularly those around the 160.00 level. But, with that said there could also be scope for working with the descending triangle on the weekly, as it’s been that resistance zone from 163.00-163.38 that’s continued to hold highs. Another flicker into that zone combined with a reaction, shown by an upper wick in that area, keeps the door open for bearish scenarios. And if sellers can finally take out the 160.00 level with a closed body on the daily, then longer-term support still looms in the 155.00-155.93 zone.
EUR/JPY Daily Chart
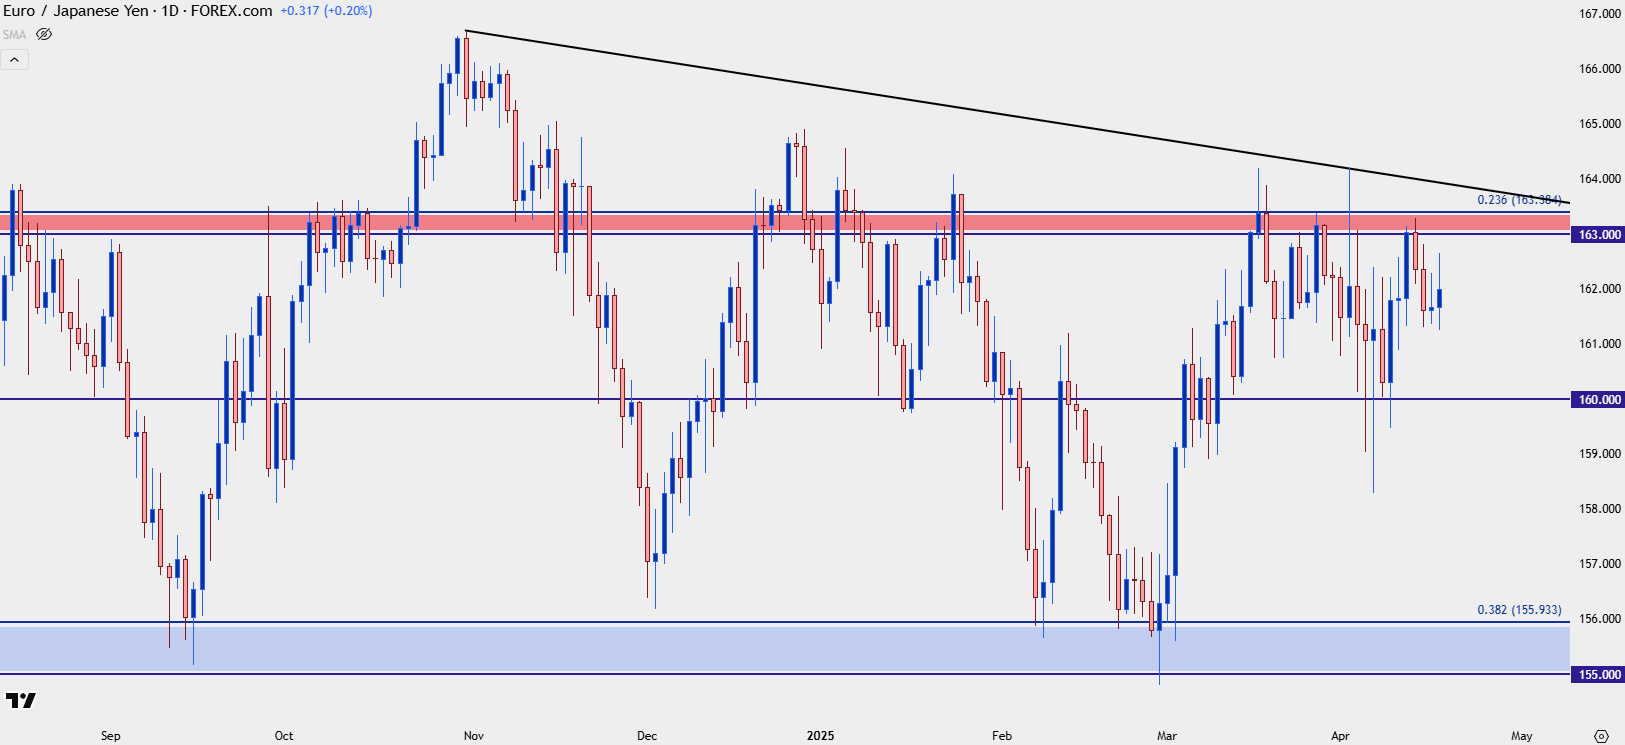 Chart prepared by James Stanley; data derived from Tradingview
EUR/GBP
EUR/GBP is a pair that I don’t often write about as I’m normally focused on major FX pairs or perhaps JPY-pairs. In my mind, generally speaking, a natural cross like EUR/GBP can tend towards lower volatility and smaller moves, but that certainly hasn’t been the case over the past few weeks.
I started looking into the possibility of bullish reversals in EUR/GBP the last time I wrote about the pair in the British Pound forecast back in February. That article did not catch the low perfectly, as sellers pushed for a couple of weeks after, bit it was that same zone from .8311-.8328 that caught the lows in March that have led to this massive bounce over the past few weeks.
EUR/GBP Weekly Price Chart
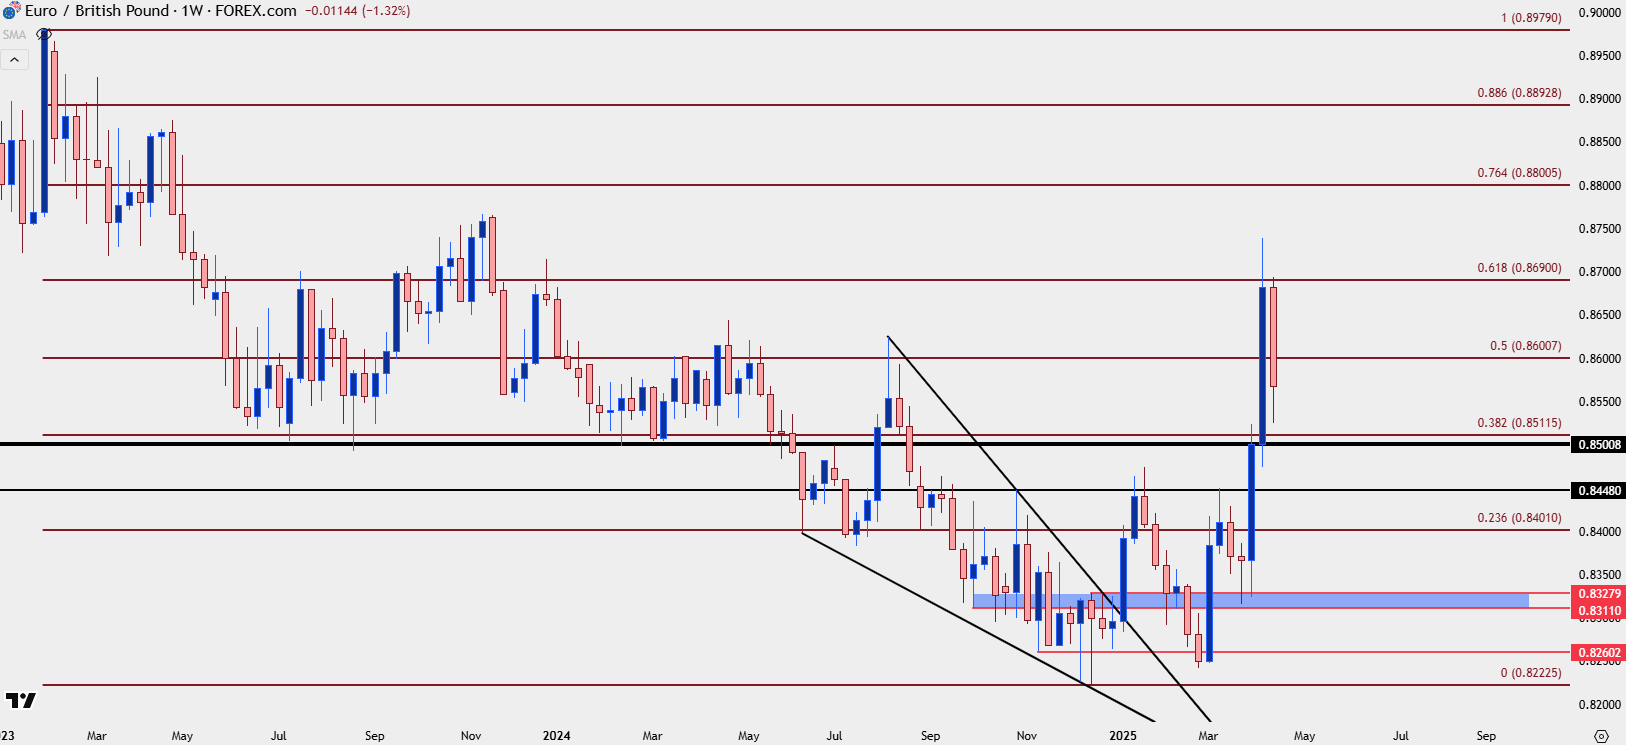 Chart prepared by James Stanley; data derived from Tradingview
From the weekly chart above, there’s an important spot around the .8500 handle and this can present a backdrop for higher-low support to play. The 38.2% retracement of the 2023-2024 move shows at .8512 and notably the 61.8% retracement of that move has so far marked resistance over the past two weeks.
For topside trends to remain attractive bulls would want to see buyers show up to protect that very obvious point of possible support around the .8500 level which is confluent with that Fibonacci retracement.
EUR/GBP Daily Chart
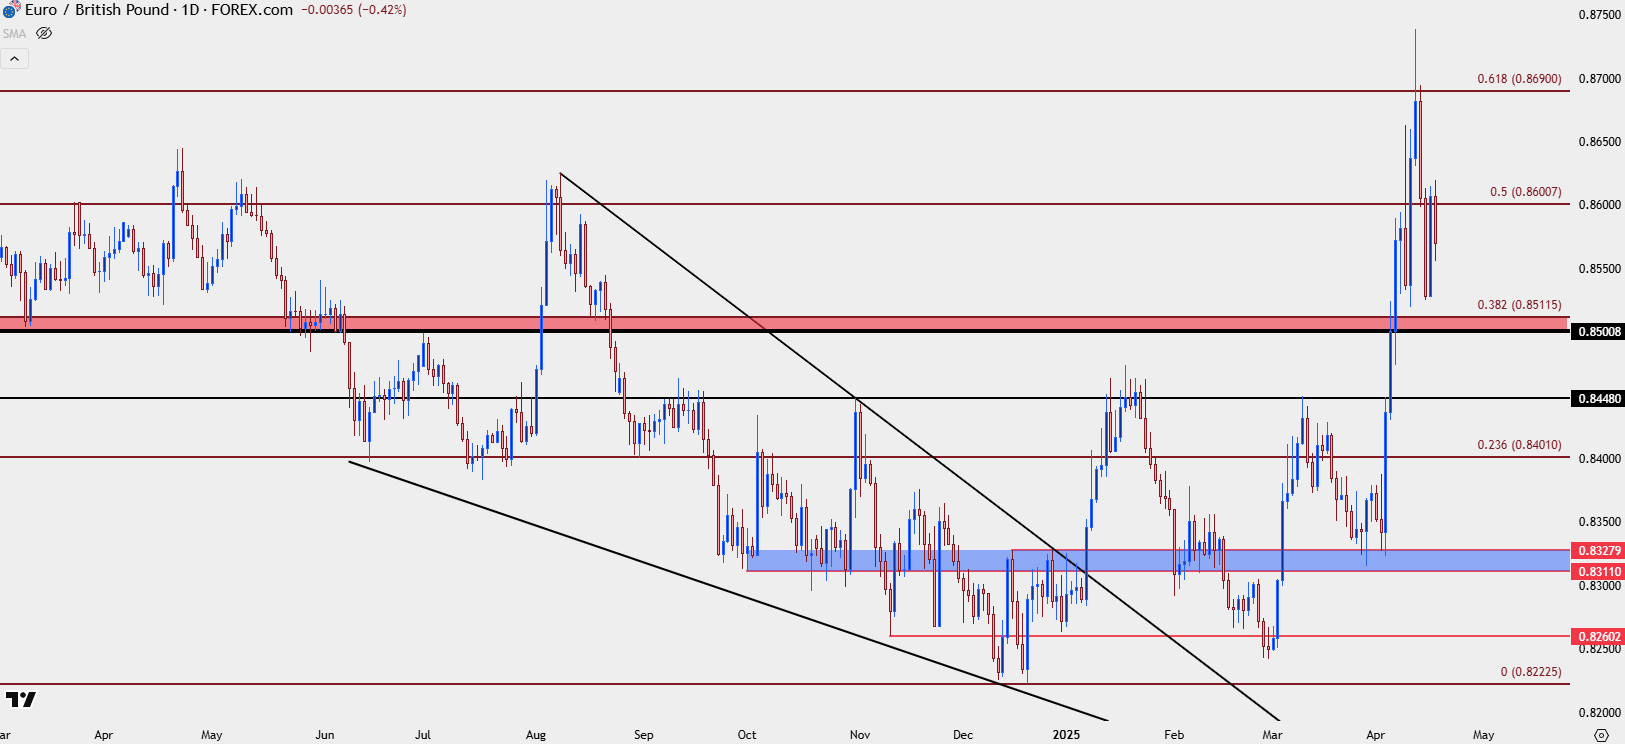 Chart prepared by James Stanley; data derived from Tradingview
--- written by James Stanley, Senior Strategist
Latest market news
September 18, 2025 02:48 PM
June 23, 2025 01:22 PM
June 23, 2025 10:39 AM
June 20, 2025 05:23 PM
June 20, 2025 04:46 PM
June 20, 2025 02:18 PM

June 19, 2025 09:09 AM

June 18, 2025 02:55 PM

June 18, 2025 08:19 AM

June 18, 2025 02:21 AM