

Euro, EUR/USD Talking Points:
- EUR/USD was up by 4.74% in the month of April which is its strongest monthly rally since November of 2022, when the ECB was ramping up rate hikes to address inflation.
- This time the ECB isn’t looking to hike rates and markets are expecting the bank to cut, which highlights that the move seems to be more of a referendum on the U.S. Dollar as the focus has heavily shifted to tariffs.
- For this week, the focus is the Fed with the Wednesday rate decision. To date they’ve refrained from leaning too dovish even amidst pain in equities, highlighting the expectation of inflation to derive from tariffs. There are no updated projections at this meeting so Chair Powell will have centerstage and he’s been noticeably avoidant of dovish language so far this year.

Coming into the year it was doom-and-gloom for the Euro, and EUR/USD, especially. It was all about Dollar domination as the USD had strung together one of its strongest quarterly outings in years. I talked about this back in January, as the USD had posed a rally of more than 7.6% for Q4 which is the strongest one quarter move since 2015.
But, as the old saying goes, ‘there’s nothing like price to shape sentiment.’
The month of January ended up as indecisive with a doji printing, and the same happened for EUR/USD. Even into the month of February calls for parity were popular as EUR/USD had just grasped on to the 1.0200 handle in the prior month and the threat of tariffs, which seemed to be USD-positive at the time, brought the prospect of more.
But that’s when matters began to shift, from the very first weekend of February ironically enough. At the time all of the attention seemed to be on Canada but it was that first weekend, when tariffs were supposed to come into effect on the northern neighbor of the U.S., that Trump began to shift the focus to Europe. He said in an almost off-handed manner that weekend that Europe tariffs the U.S., and it wasn’t fair, and tariffs would be coming for Europe, too.
The open after that weekend saw EUR/USD hurriedly sell-off; but interestingly, sellers couldn’t carve out a fresh low. The pair was already oversold and beleaguered after a brutal four-month stretch but as prices moved closer to the 1.0200 handle, sellers slowed down, and demand began to show.
The net of February was a second consecutive month of indecision on the EUR/USD chart and it was March when the turn actually started to show – but this was, again, very much driven by the U.S. side of the matter as it was recessionary fears that helped to drive a massive drawdown in the USD. That sell-off continued through the first 11 days of April as tariff threats remained from and center, with EUR/USD extending all the way up to a fresh three-year high.
EUR/USD Monthly Chart
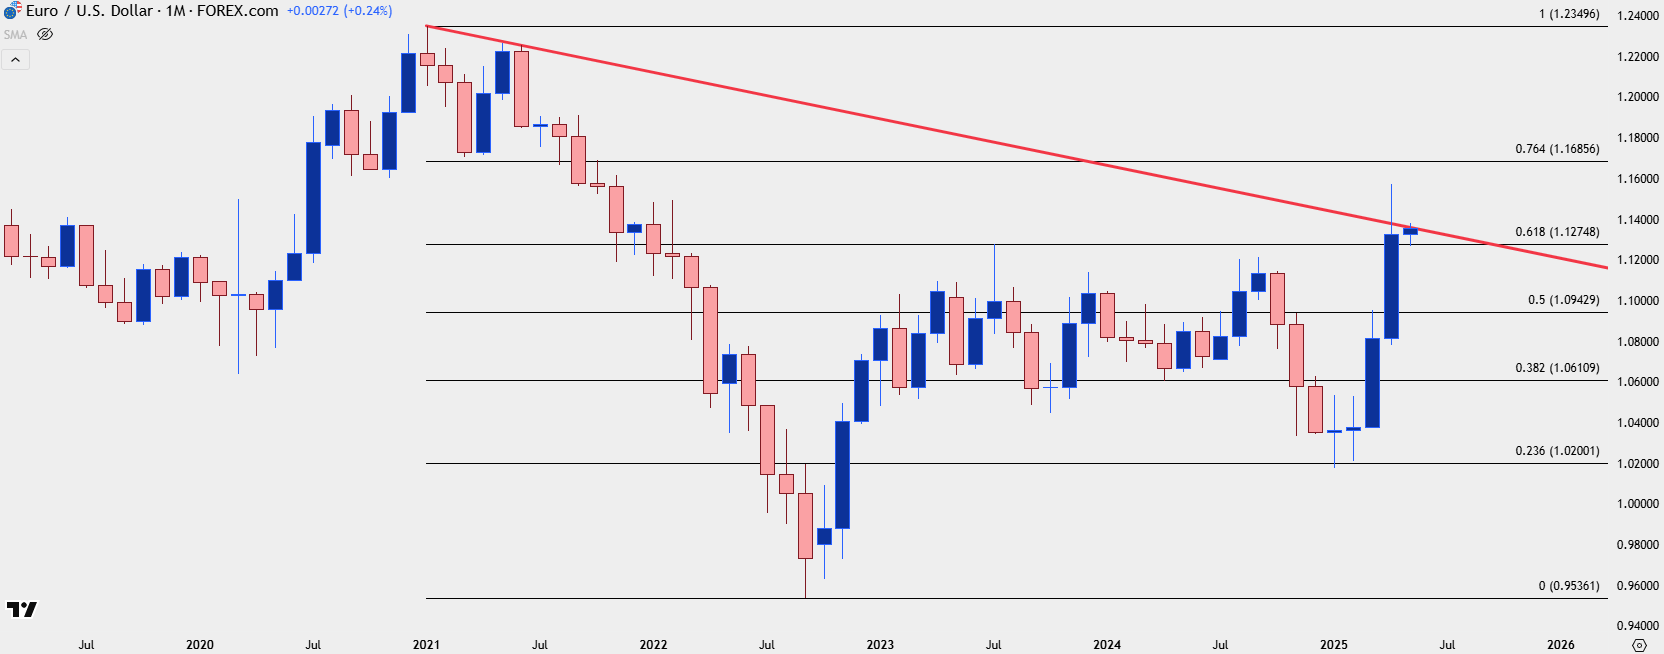 Chart prepared by James Stanley; data derived from Tradingview
EUR/USD Weekly
Major trends take time to turn, similar to what we saw in January and February. When they do ultimately turn, the force can be significant, like we saw in March and April. But for a major market like EUR/USD to suddenly and abruptly change course and then reverse, several repercussions can happen.
We had another reversal in the pair just last year, when a rally in Q3 rammed up against the 1.1200 level with a strong bearish reversal taking over around the Q4 open. Similarly, it took about a month of failure from bulls to breakthrough 1.1200 before sellers were ultimately able to prevail.
I’ve been using the RSI indicator in USD to illustrate this because weekly USD went oversold in April and the last time that happened was the Q3 instance that I noted above. In that case, sellers didn’t stop as soon as RSI tagged oversold, as it took another five weeks of sellers spinning their wheels before buyers were able to push the bullish reversal. In EUR/USD, RSI didn’t quite make it to overbought territory last year as the indicator topped at 69.8 on the weekly chart. But that did lead to a pullback to 1.1000 – which bulls bought – and drove right back to the 1.1200 handle for another failure.
In this instance, EUR/USD has went into overbought territory and that showed up along with a shooting star formation on the weekly chart. Last week saw a second consecutive weekly loss, although buyers have so far held support at a key Fibonacci level of 1.1275.
As I said in the Tuesday webinar, this is mounting evidence of turn potential but we’re still at that awkward stage like we were in January and February or last year in September where the dominant trend still has potential, even with the opposing side showing a bit more vividly.
EUR/USD Weekly Chart
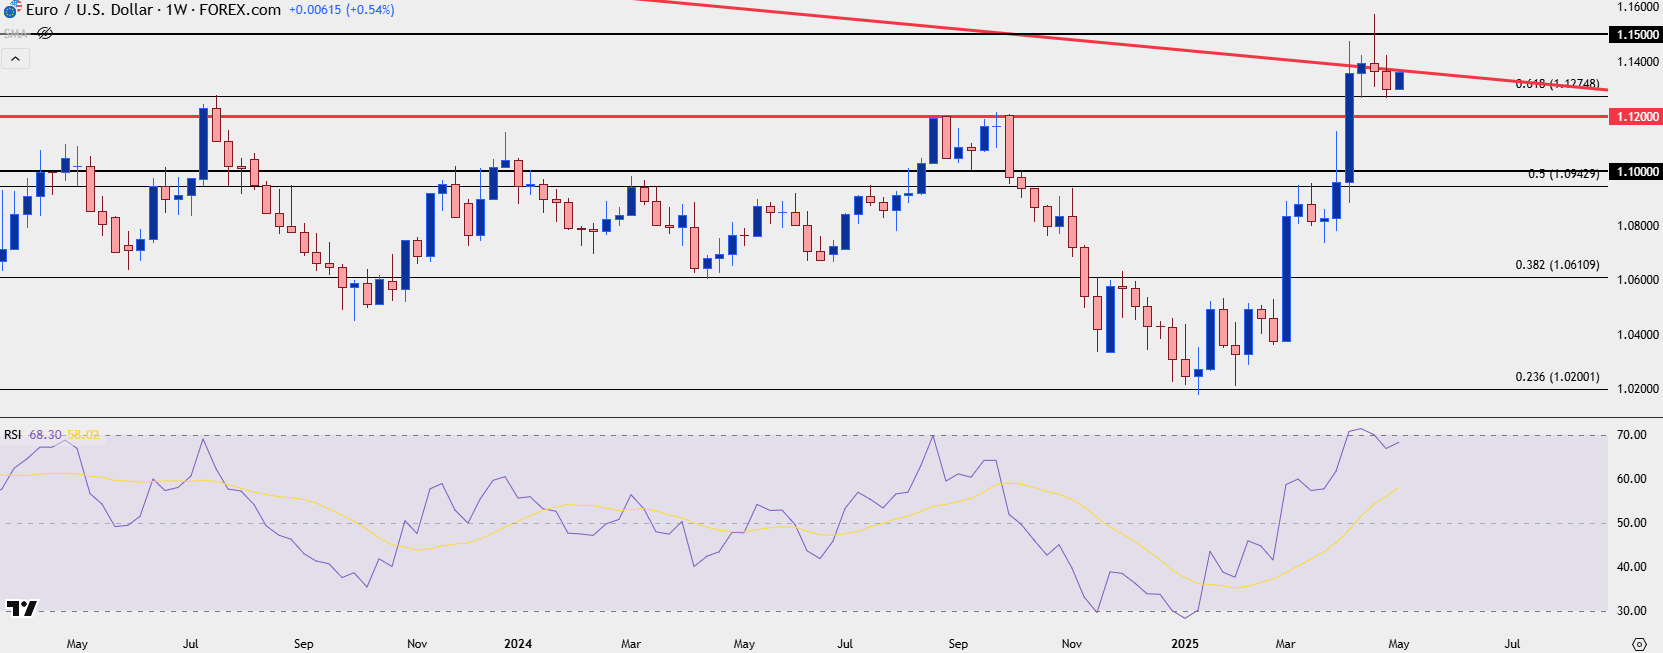 Chart prepared by James Stanley; data derived from Tradingview
EUR/USD Shorter-Term: Piece by Piece
Major psychological levels can have a big bearing on these moves, such as we saw with 1.0200 earlier in the year or 1.1200 and 1.1000 last year. And then more recently, the 1.1500 handle a couple of weeks ago.
For this week, that’s the major level for bulls to encounter if they do want to continue the rally from March and April. And on the bearish side, if we do want to see sellers take a larger role in the pullback move in EUR/USD, and conversely, bulls a stronger hand with the USD rally, then the 1.1200 level is the next major waypoint on the EUR/USD chart.
EUR/USD Daily Price Chart
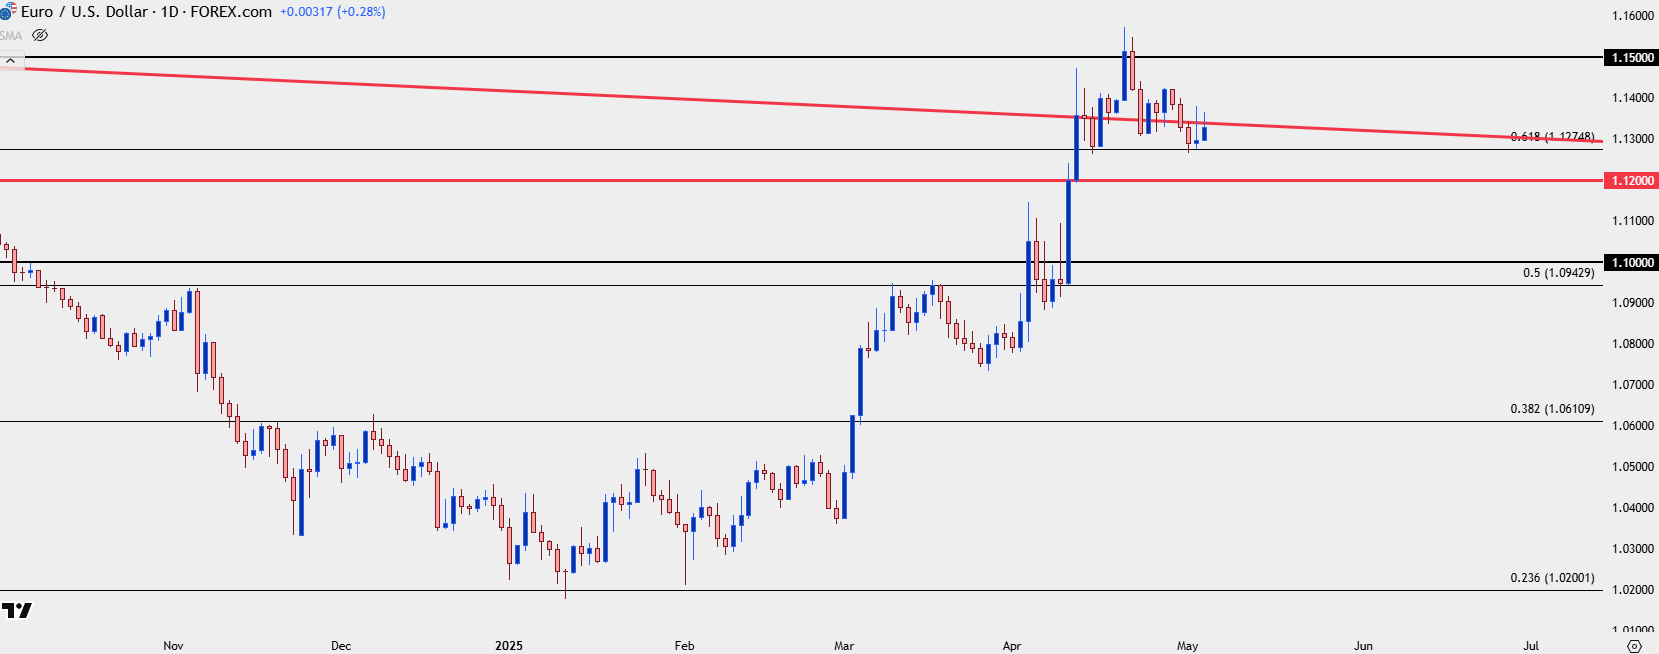 Chart prepared by James Stanley; data derived from Tradingview
--- written by James Stanley, Senior Strategist
Latest market news
September 18, 2025 02:48 PM
June 23, 2025 01:22 PM
June 23, 2025 10:39 AM
June 20, 2025 05:23 PM
June 20, 2025 04:46 PM
June 20, 2025 02:18 PM

June 19, 2025 09:09 AM

June 18, 2025 02:55 PM

June 18, 2025 08:19 AM

June 18, 2025 02:21 AM