

Euro Technical Outlook:
- Last week’s breakout was faded into the end of the week with prices pulling back below 1.1000 but holding above the 1.0943 Fibonacci level.
- While trends have been whipsawing, there has been a respect of big figures, with 1.1100 holding last week’s highs and 1.0900 this week’s lows. In between the two, the major psychological level of 1.1000 continues to loom large; and longer-term, 1.1200 was a brick wall of resistance for bulls last Q3.
- That USD strength and EUR/USD weakness initially held through the weekly open, but the dominant trend came back and EUR/USD is testing back above the 1.1000 big figure which indicates growing acceptance above that price.

USD-weakness has remained so far this week as tensions remain high around the tariff topic in the United States. While last week was largely concentrated to a Thursday breakdown, which led to an inside bar on Friday in the USD, this week has seen that trend of weakness continue and EUR/USD has rallied in response.
I looked into the pair in yesterday’s webinar looking at the possibility of a higher-low on the daily chart. That has since held and buyers have come back into the picture to push price back-above the 1.1000 psychological level, which remains a significant level for the pair. The next two big figures sitting overhead are also important, as 1.1100 is what marked resistance last week on both Thursday and Friday, and then 1.1200 was a brick wall of resistance back in Q3 of last year that held until the pair ultimately unraveled with the Q4 reversal in the U.S. Dollar.
And on the other side of the matter, it was the 1.0900 level that held support on Monday and then Tuesday, allowing for the slightly higher-low yesterday that has since pushed into bullish continuation. So, while the move has been volatile on the edges, there has been a degree of order as shown by respect of round levels so far.
EUR/USD Daily Chart
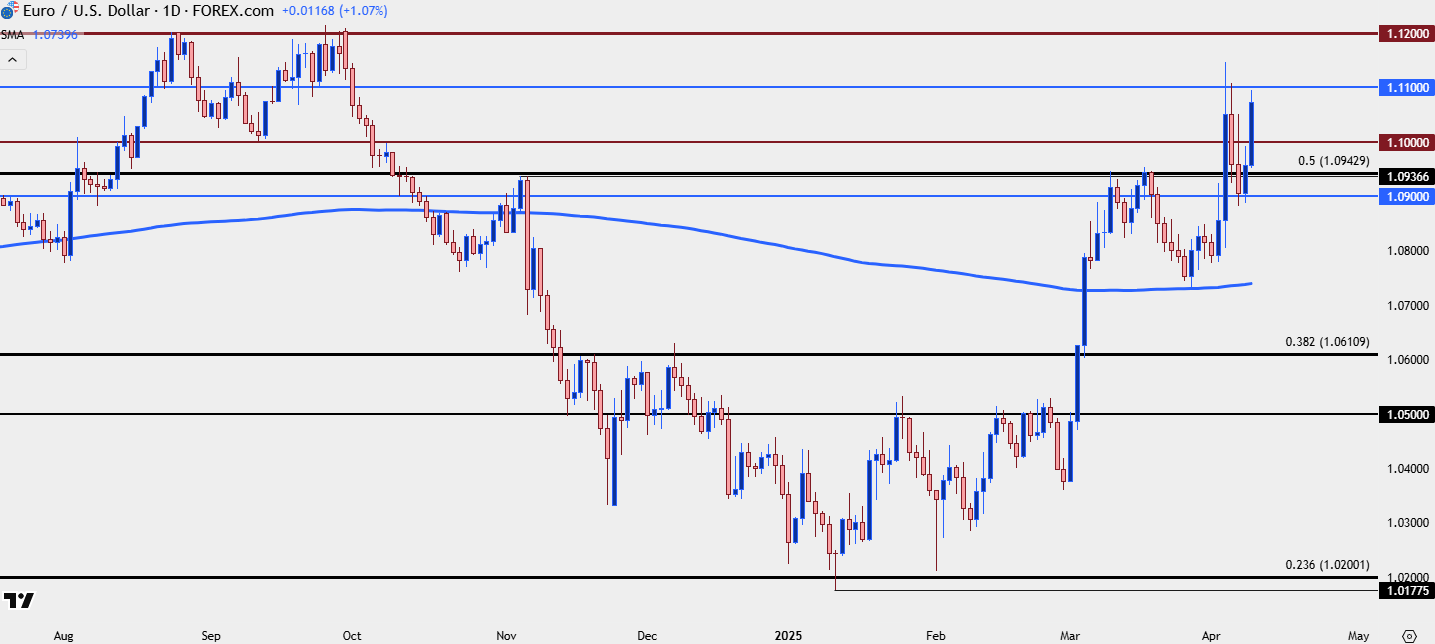 Chart prepared by James Stanley; data derived from Tradingview
EUR/USD Bigger Picture
The challenge for bullish continuation right now in EUR/USD is proximity to longer-term resistance; and the mirror image of that, the challenge with chasing the USD-lower at the moment is proximity to longer-term support. We saw a similar dynamic play out last year, when a super-charged EUR/USD in Q3 had a full head of steam as it headed for the 2023 high, which was right at the 61.8% Fibonacci retracement of the 2021-2022 major move.
But it was the 1.1200 level that was their stumbling block – twice as the initial test in August led to a recoil until 1.1000 came into play, and the second test holding three weeks of grind until ultimately sellers could take over.
Given the prior pullback in March down to the 200-day moving average with the low now more than 300 pips away, this can be an incredibly difficult move to chase with those levels coming into view. Shorter-term, however, could offer a bit more context which I’ll look at below.
EUR/USD Weekly Chart
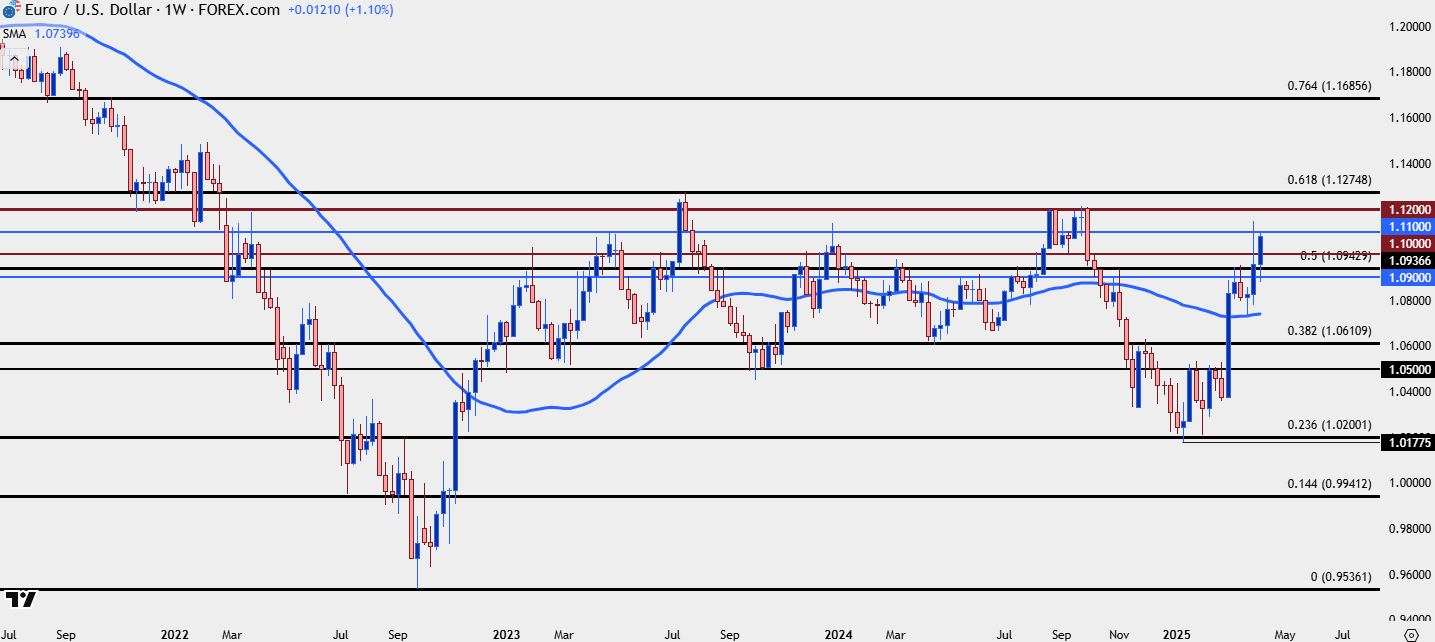 Chart prepared by James Stanley; data derived from Tradingview
EUR/USD Shorter-Term Strategy
With price nearing those resistance points that haven’t yet yielded, the risk-reward for setups, especially plotted from longer-terms, can be seen as unattractive in a variety of perspectives.
Given the weekly lows holding around 1.0900, however, there could be a couple of supports that could be tracked as higher-lows to look for continuation moves into those resistance levels. The 1.1000 becomes an obvious level to track, and ideally, that’s the price that bulls will hold in pullback scenarios if it does come into play. The very nature of ‘psychological levels’ is that they’re a manifestation of sentiment: If price dips below 1.1000 and then bulls feel a perceived value, to the point where they come in and execute on all available supply to the point that they can begin tilting prices higher, that could be an attractive item. This can be illustrated by underside wicks on the four-hour or daily chart, showing that intra-bar test that brought buyers back into the matter to the point that they re-grasped control of near-term price.
Below 1.1000 is another key level and technically, this level hasn’t shown much for support yet despite holding as resistance twice in March, and that the 1.0943 Fibonacci level. Even if buyers can’t hold support at 1.1000 and prices slide, there’s another opportunity for a higher-low above the 1.0900 support at that 1.0943 level.
EUR/USD Four-Hour Chart
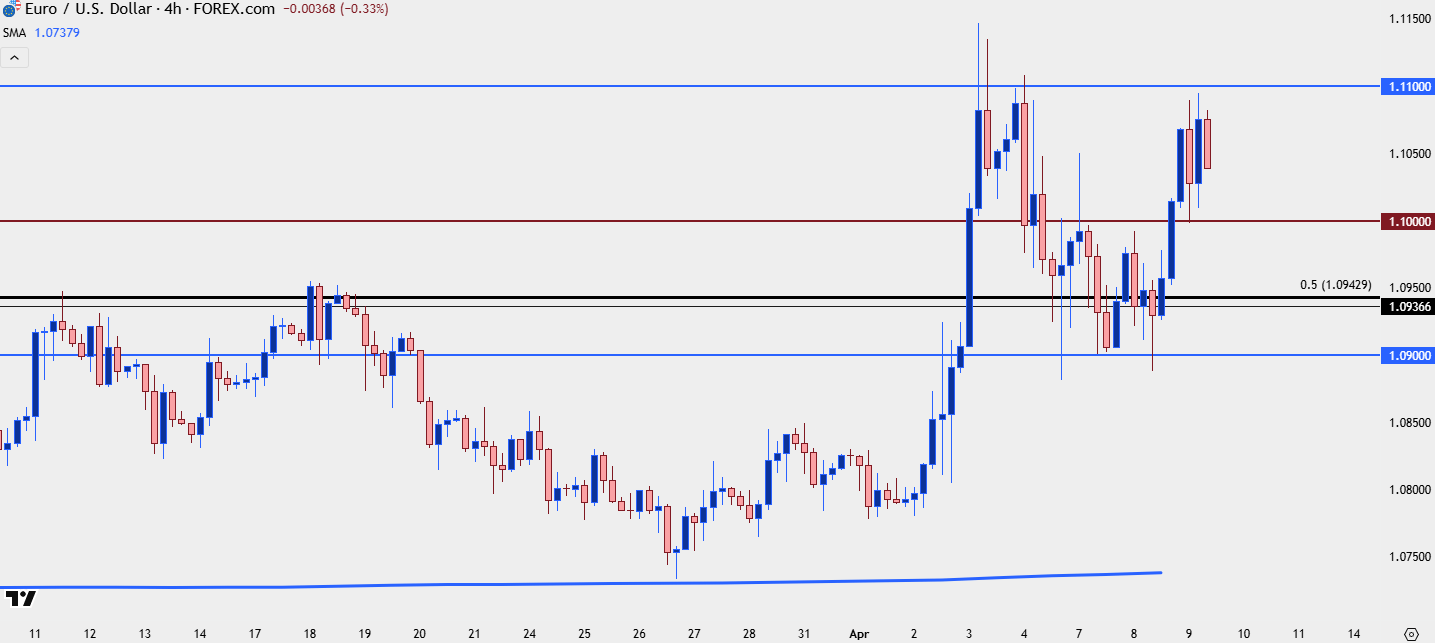 Chart prepared by James Stanley; data derived from Tradingview
--- written by James Stanley, Senior Strategist
Latest market news
September 18, 2025 02:48 PM
June 23, 2025 01:22 PM
June 23, 2025 10:39 AM
June 20, 2025 05:23 PM
June 20, 2025 04:46 PM
June 20, 2025 02:18 PM

June 19, 2025 09:09 AM

June 18, 2025 02:55 PM

June 18, 2025 08:19 AM

June 18, 2025 02:21 AM