

Key Events
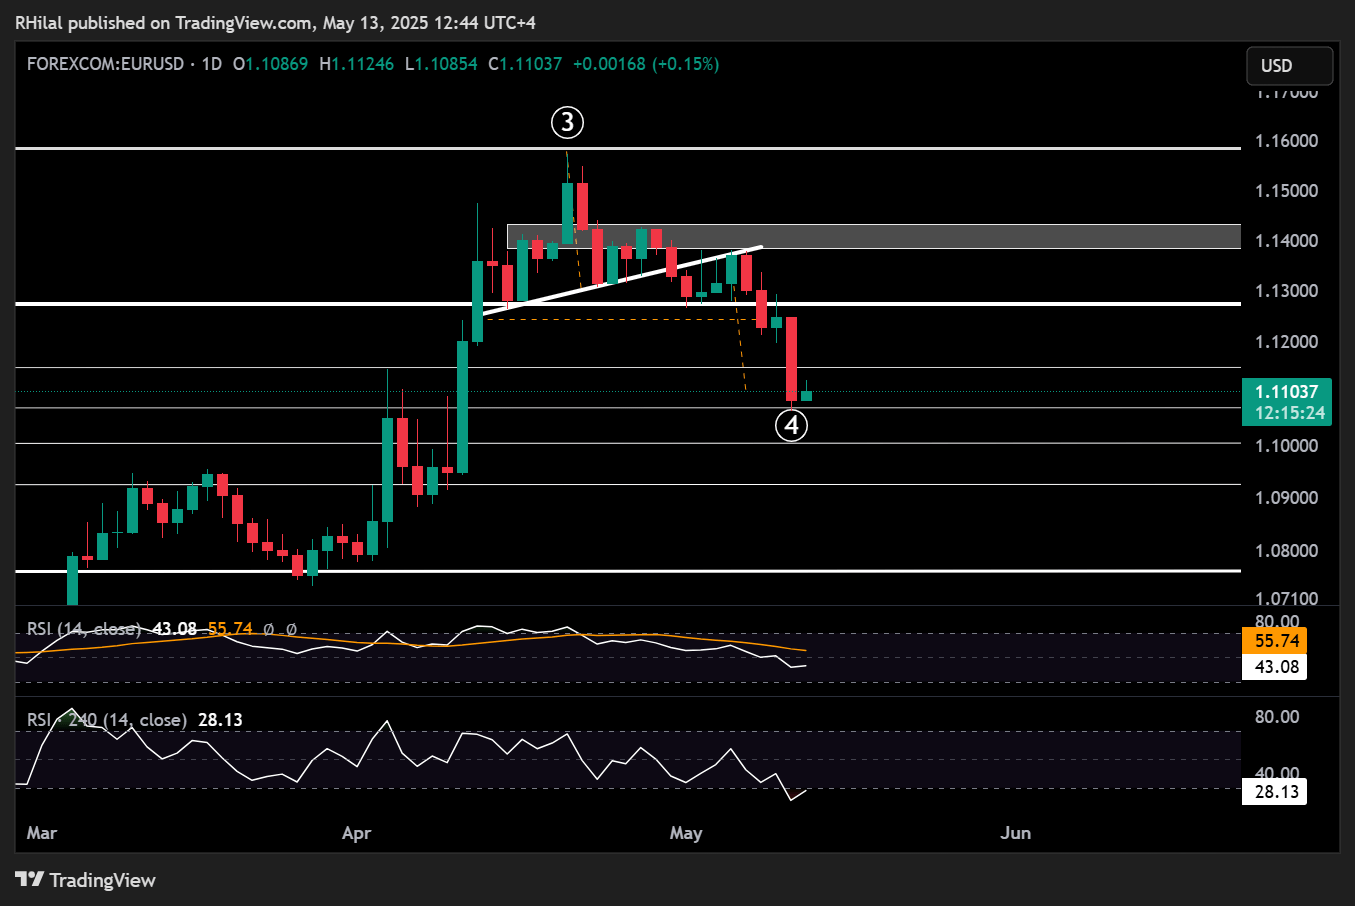
- EURUSD completes a head and shoulders pattern driven by trade deal optimism
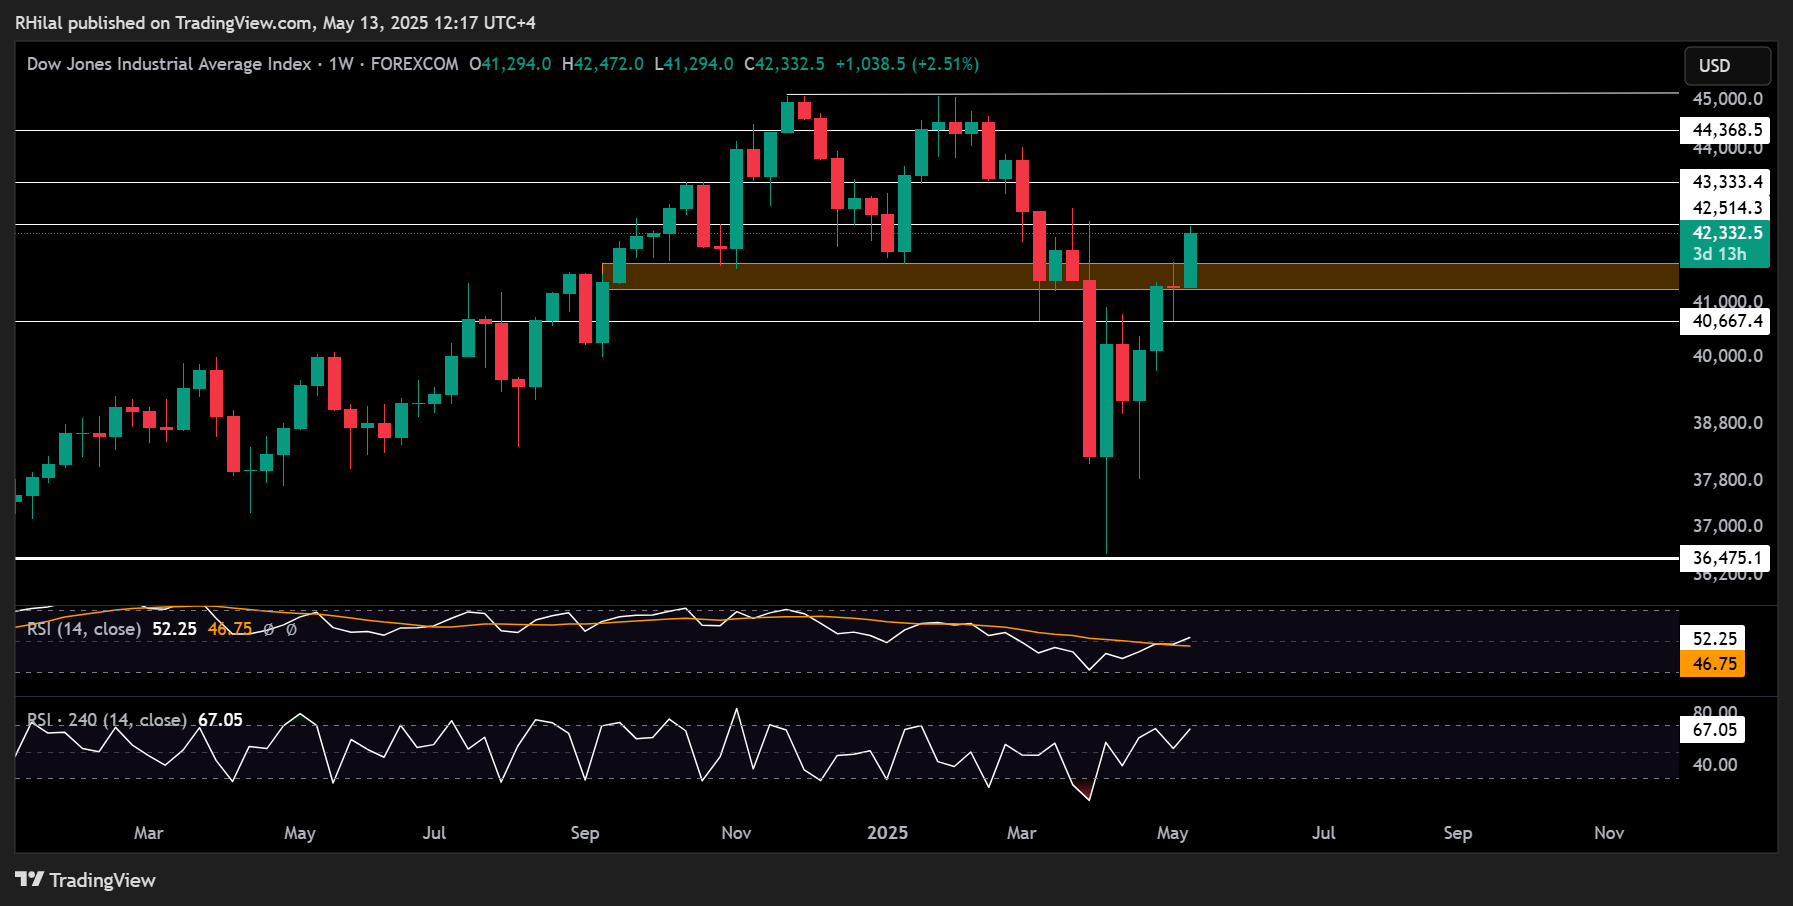
- Dow Jones breaks above the “Liberation Day” zone, targeting 42,400 resistance
- U.S. CPI is due today, following PCE figures last seen at 2020 levels
Trade Optimism vs. Economic Data
Following headlines about the 90-day U.S.–China tariff cut, markets broke toward notable support and resistance levels despite soft US economic data, laying the groundwork for either trend continuation or reversal — with the next catalyst likely to be today’s U.S. CPI release. Much of the price action unfolded ahead of the headlines.
A momentum reset — whether through consolidation or a short-term pullback — may now be underway before the market attempts a return to the primary bullish trend, potentially pushing above the December 2024 to February 2025 double top zones, as shown in the chart below.
Dow, Nasdaq, SPX500 – Weekly Time Frame (Log Scale)

Source: TradingView

EURUSD Outlook – 4H Time Frame (Log Scale)
Source: TradingView
In line with the inverted head and shoulders formation seen on the DXY from its 2025 lows, EURUSD has completed a breakout of its own head and shoulders pattern, reaching the 1.1070 target. With the 4H RSI rebounding from oversold territory, a bullish bounce for EURUSD appears likely toward the 1.1140 level.
A clean hold above this resistance could extend gains to 1.1270, 1.1380, 1.1430, and eventually to the 2025 high at 1.1570. If dollar strength resumes and EURUSD falls back below 1.1070, downside levels to watch include 1.1000, 1.0920, and 1.0760.

Dow Outlook – Weekly Time Frame (Log Scale)
Source: TradingView
As shown in the indices chart above, the Dow Jones has broken above the neckline of its double top pattern at the 41,700 zone, now eyeing resistance targets at 42,500, 43,300, 44,300, and a potential breakout to new all-time highs.
From the downside, failure to hold above 42,500 could trigger a pullback, with support levels to watch likely at 41,700, 41,300, and 40,700, respectively.
Written by Razan Hilal, CMT
Follow on X: @Rh_waves
Latest market news
September 18, 2025 02:48 PM
June 23, 2025 01:22 PM
June 23, 2025 10:39 AM
June 20, 2025 05:23 PM
June 20, 2025 04:46 PM
June 20, 2025 03:35 PM

May 28, 2025 11:01 AM

May 27, 2025 07:21 AM

May 22, 2025 11:14 AM

May 12, 2025 06:44 AM