
EUR/USD Talking Points:
- It was a big week for EUR/USD as the pair pushed up to a fresh three-year-high.
- It was also a dramatic week for the US Dollar, driving a flurry of ‘de-dollarization’ claims on social media, similar to the prior weekend’s claims of ‘Black Monday’ ahead of this week’s open.
- For next week the ECB is widely expected to cut rates again, explained further in the below video.
EUR/USD had a strong technical backdrop earlier in the week. I looked at the pair as my favored short-USD scenario in the Tuesday webinar, highlighting the higher-lows at the 1.0900 handle. And as I said then, the 1.0943 Fibonacci level remained a big deal to me, and ultimately that’s what helped to set another higher-low on Wednesday.
After that – a massive move developed with EUR/USD spiking up to a fresh three-year-high. The USD dropped in dramatic fashion and USD/JPY even threatened a larger breakdown move.
While we have seen some recovery in equities there are other items that remain of concern, such as the spike in Treasury yields that showed this week, or the parabolic-like move that developed in gold. These items suggest that we may not have seen the apex of volatility just yet, and they remain on the front burner for next week.
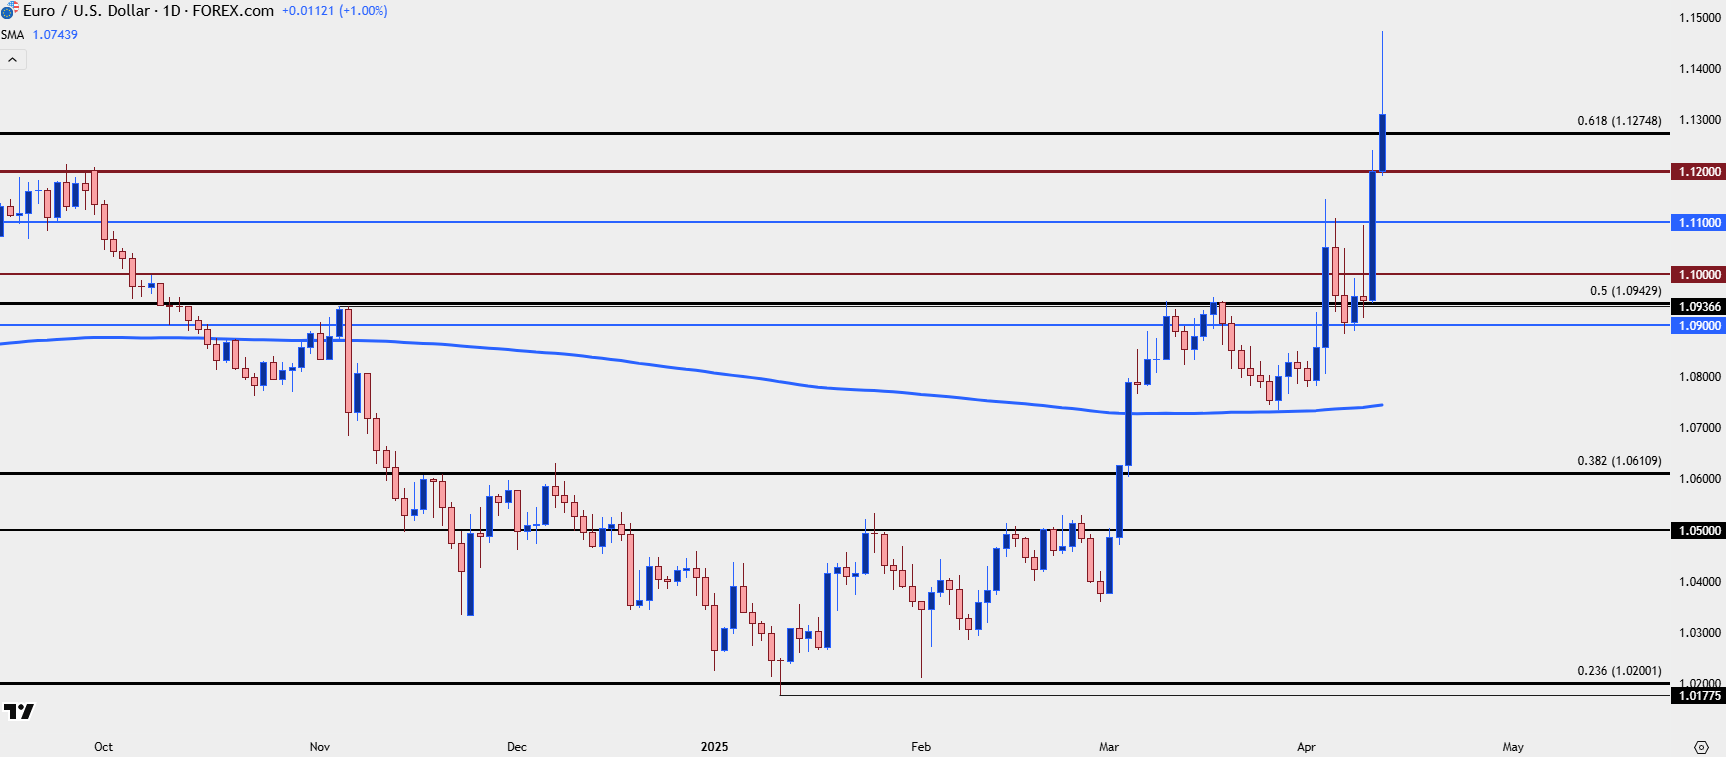
In FX-land, next week’s ECB rate decision is expected to bring another rate cut and the question here is whether bulls can show trend continuation by holding support at higher-lows. The 1.1275 level has some longer-term consideration as this is the 61.8% retracement of the 2021-2022 major move, which is the same retracement that produced the 50% marker at 1.0943 that’s been resistance-turned-support of late. Below that, the 1.1200 handle remains key as that was last year’s high, holding bulls at bay on multiple occasions before the Q4 reversal developed. And then 1.1100 even has some interest as this was prior resistance from earlier in April and, to date, hasn’t been re-tested as support.
EUR/USD Daily Price Chart
EUR/USD Bigger Picture Resistance Potential
EUR/USD made a charge at the 1.1500 handle but fell less than 30 pips short of a test. But as covered before, a psychological level of that magnitude can produce impact without actually having to come into play, as getting closer and closer to what seems an obvious area of resistance can begin to dissuade bulls from chasing the move higher, thereby motivating profit taking, especially after a really strong move.
But that becomes the next major level of resistance overhead, in my mind. And above that, there’s a Fibonacci retracement at 1.1686 and this is related to the 1.1275 (61.8%) and 1.0943 (50%) levels.

EUR/USD Monthly Price Chart
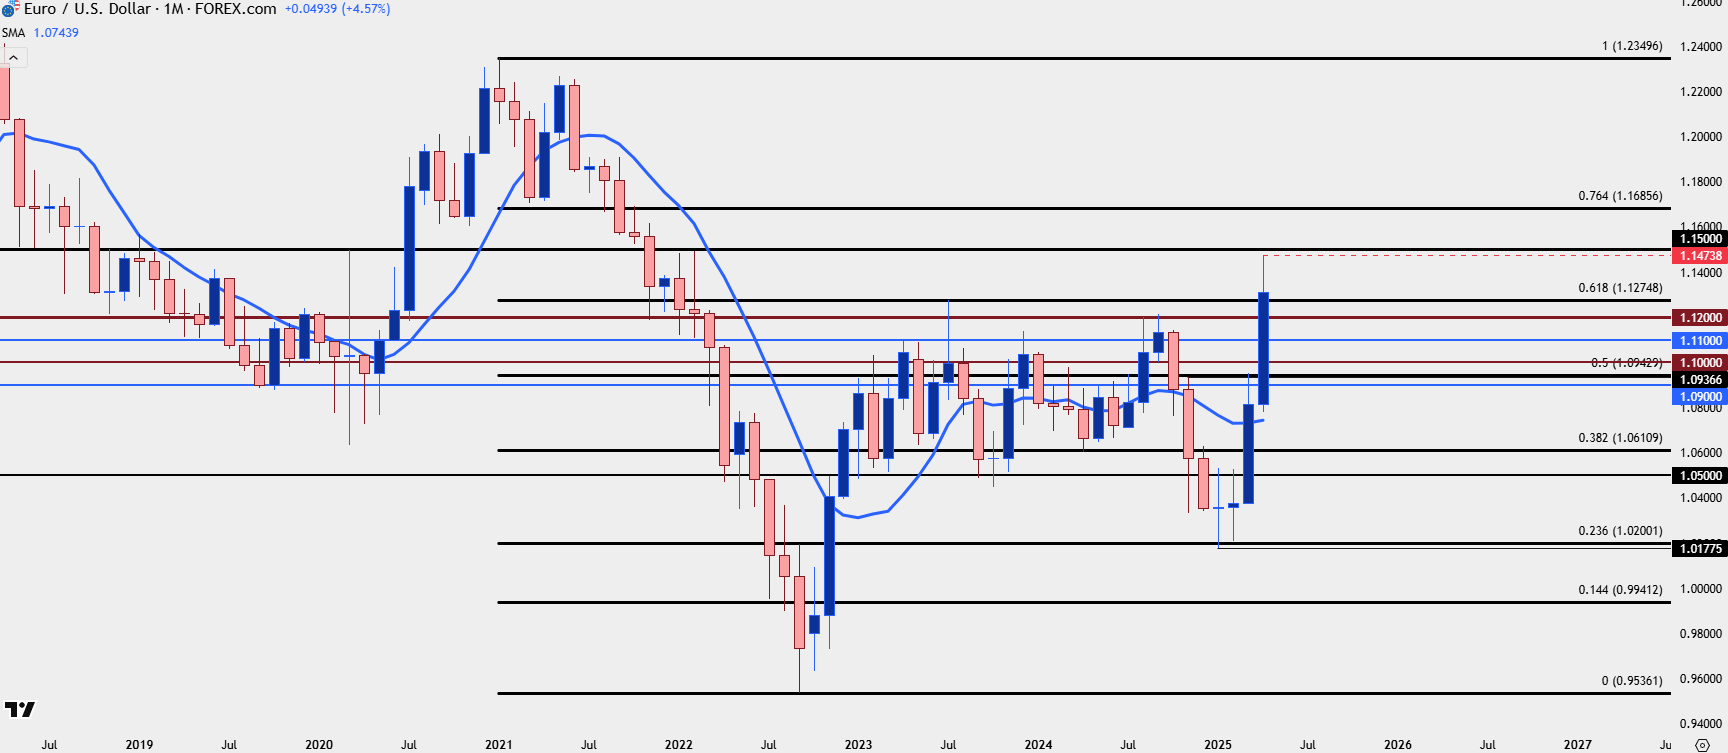 Chart prepared by James Stanley; data derived from Tradingview
EUR/USD Bullish Structure
The shorter-term four-hour chart highlights the continued build of bullish structure and as you’ll notice the 1.1275 level has already come in for a short-term support test. Below that, 1.1200 was Q3 and 2024 resistance, and below that, 1.1100 was earlier resistance in April.
Even the 1.1000 handle retains some interest as it was 1.0900 that helped to set lows earlier this week.
The trend has developed quite a bit since the 200-day moving average test from late-March, but I’d probably look to closed body breaks on the daily through 1.0900 as an indication of failure from bulls to hold the trend.
EUR/USD Four-Hour Price Chart
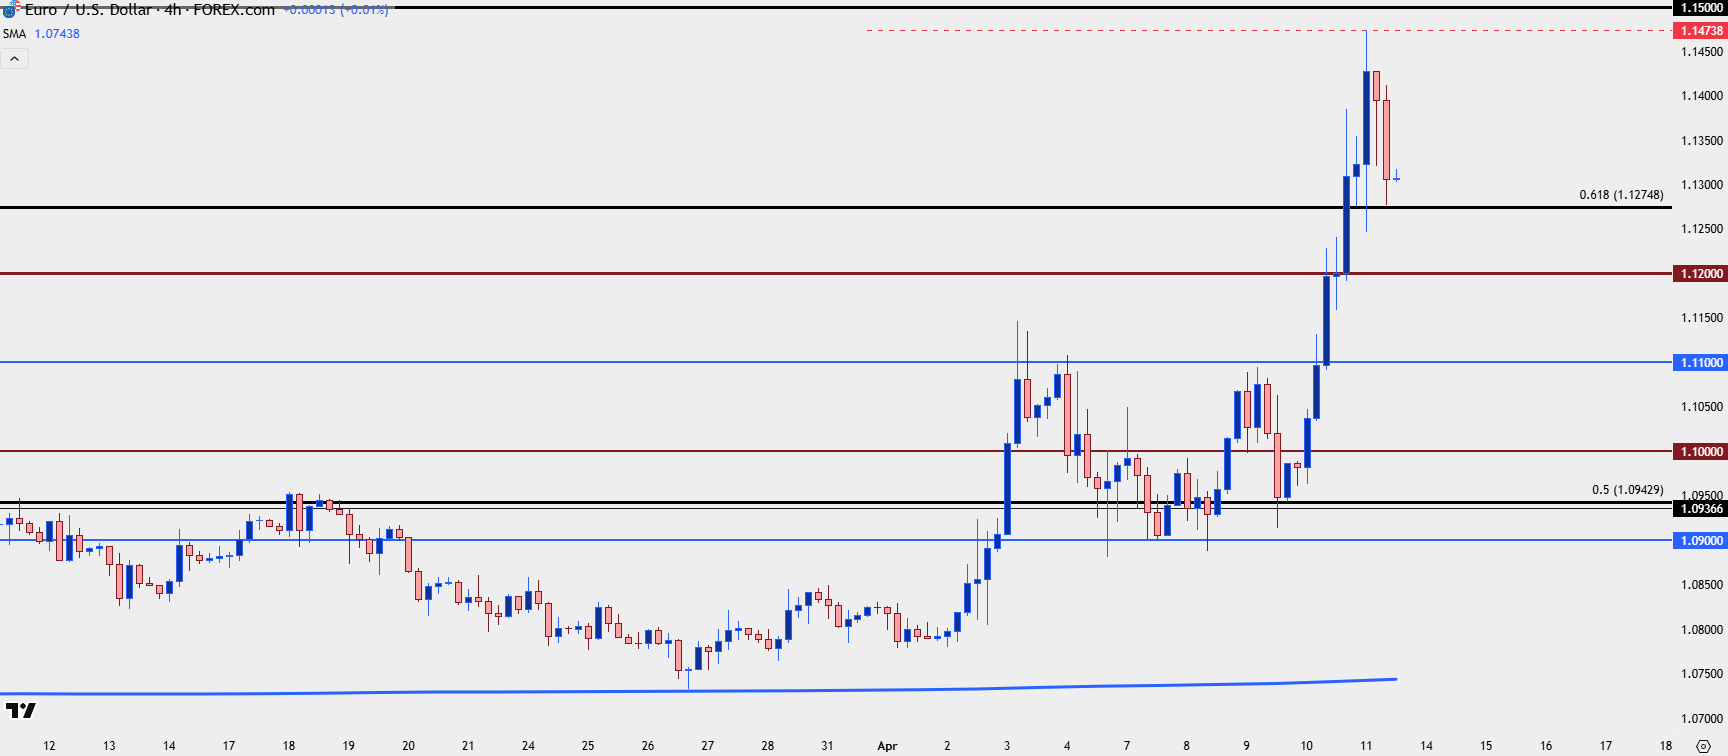 Chart prepared by James Stanley; data derived from Tradingview
--- written by James Stanley, Senior Strategist
Latest market news
September 18, 2025 02:48 PM
June 23, 2025 01:22 PM
June 23, 2025 10:39 AM
June 20, 2025 05:23 PM
June 20, 2025 04:46 PM
June 20, 2025 03:35 PM

February 10, 2025 08:45 PM

February 1, 2025 02:00 AM

January 1, 2025 07:30 AM

December 23, 2024 02:45 PM