

EUR/USD Talking Points:
- After a massive start to the month of March EUR/USD has stalled at resistance for the past week-and-a-half.
- It’s the 1.0943 Fibonacci level that bulls haven’t been able to leave behind and as we move into FOMC in a couple of hours, the Euro appears to be the large variable around whether the USD can spark a reversal.
- I looked into EUR/USD and USD in-depth in yesterday’s webinar and that’s a common occurrence in the Tuesday session. You’re welcome to join the next. Click here for registration information.

After a massively strong start to the month of March bulls have slowed over the past week-and-a-half. Resistance has shown at a major spot, with the 1.0943 Fibonacci level marking the high over the past week after the prolonged breakout in EUR/USD. The move hasn’t been tested much on the other side yet, as pullbacks have been rather shallow and, so far, they’ve held course along an ascending trendline of higher-lows. As looked at in the webinar yesterday, this keeps bulls in control and this sets up an ascending triangle formation, often approached with aim of bullish breakout potential.
The logic behind the formation is clear, as it’s essentially following a diminishing response at resistance, and if bulls do continue to show more aggression with even higher-lows, the door can soon open to breakout.
The challenge in EUR/USD is that if that breakout does hit, especially with daily RSI having shown an element of divergence while crossing back-below 70, there’s a massive spot of resistance potential sitting overhead at the 1.1000 psychological level.
EUR/USD Daily Price Chart
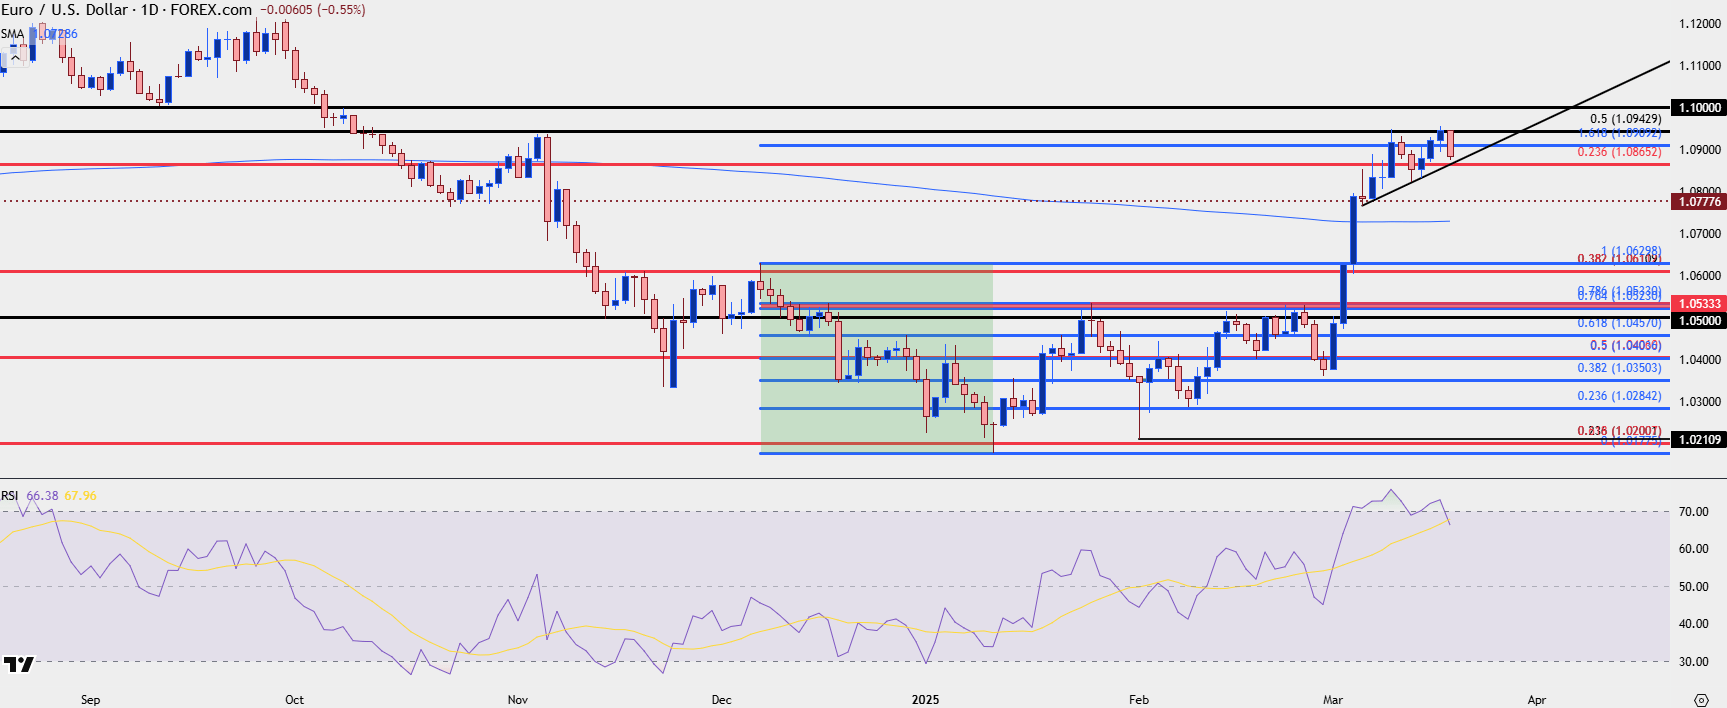 Chart prepared by James Stanley; data derived from Tradingview
EUR/USD Longer-Term
The weekly chart highlights the importance of current resistance quite well, as bulls have run into a brick wall since the 1.0943 Fibonacci level came into play.
This is a big level, as it’s the 50% mark of the 2021-2022 major move, and this was part of the Fibonacci setup that I had written about in the Fibonacci Education article back in February, as EUR/USD was defending a confluent spot at 1.0200 while setting up for breakout above 1.0500.
Perhaps most obvious is the resistance that’s held so far, highlighted by the upper wicks along last weeks and the current week’s candle. It’s important to account for the fact that this week’s candle is only about half complete, so this can change, but if we move to the end of the week in the current form this will look attractive for pullback or bearish scenarios.
Given the FOMC rate decision taking place later today, we must widen out our band of possible outcomes, so if bulls do press, the next big test overhead is that 1.1000 level, and if that doesn’t elicit a larger reversal, then the weekly bar will retain a bullish look. In that scenario, shorter-term pullbacks to support at prior resistance will become attractive, with emphasis on the current level of 1.0943.
For pullbacks – a sell-off from resistance doesn’t necessarily put bulls out of the matter, as there’s several spots of possible support for continuation scenarios. The shorter-term Fibonacci level at 1.0865 would be an aggressive spot for bulls to put up a fight, but there’s also the 200-day moving average just below that. That’s just about 20 pips below the 1.0750 psychological level, so I’m spanning those two prices together to create a zone.
Even if sellers can take that out – there’s still support potential at the confluent spot of 1.0611, or perhaps even as deep as the 1.0530 level that was resistance ahead of the breakout earlier this month. If bears can force a move down to those two areas, however, especially during this weekly bar, the premise of larger bearish reversals will begin to look more attractive, at which point 1.0865 or 1.0730 (200-dma) to 1.0750 could start to take on the tone of lower-high resistance.
EUR/USD Weekly Price Chart
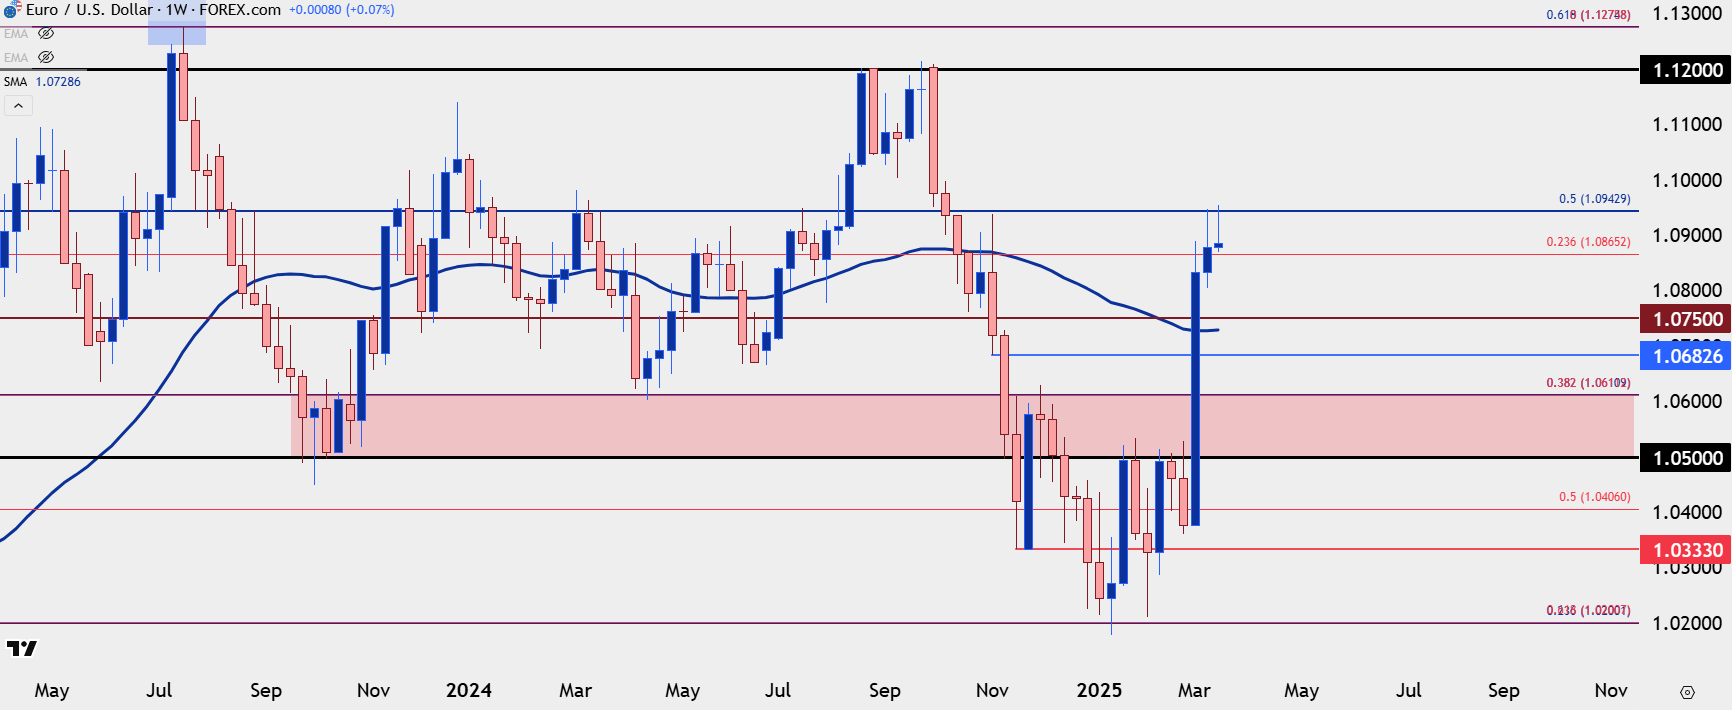 Chart prepared by James Stanley; data derived from Tradingview
EUR/USD Shorter-Term
I realize that last paragraph contained a few different twists and turns; but as noted earlier, with the FOMC a trader should widen the band of possible outcomes, especially a meeting such as we expect today where there’s no rate move priced-in but the economic projections will be the primary focal point. And as looked at in yesterday’s webinar, there’s some big questions for today, mainly whether the Fed will abandon the ‘Fed put.’ The way that they navigate today could create strong moves across markets so it’s worthwhile, at least in my opinion, to look on either side of the matter.
If we do see a net result of USD-weakness, the big level overhead in EUR/USD is that 1.1000 handle. I’d be hesitant to get too aggressive above that, but the price action after a test there should be somewhat telling. For pullback scenarios – there’s so far been a series of higher-lows holding the lows and if bulls let that slip, the next question is whether we see defense of the 1.0865 Fibonacci level, or perhaps the 1.0800 level. If we don’t, I’m anticipating a big test at the 1.0730-1.0750 zone, and the reaction to that will show whether bulls took advantage of the pullback to the 200-dma as a buying opportunity, or whether that leads to a lower-high that opens the door for a deeper, sharper pullback down to around 1.0611 or perhaps the 1.0530 area of prior resistance.
EUR/USD Four-Hour Price Chart
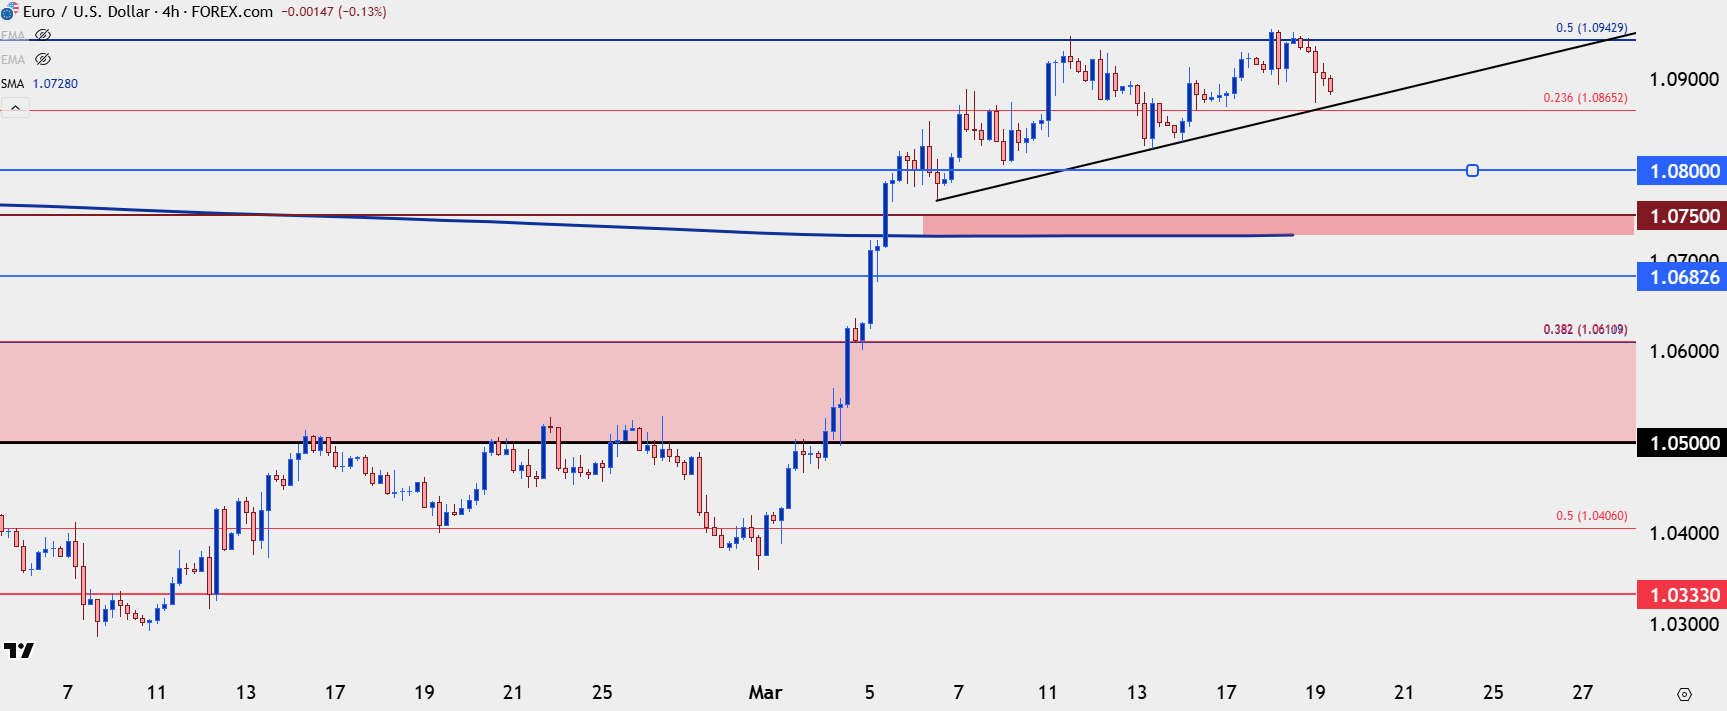 Chart prepared by James Stanley; data derived from Tradingview
--- written by James Stanley, Senior Strategist
Latest market news
September 18, 2025 02:48 PM
June 23, 2025 01:22 PM
June 23, 2025 10:39 AM
June 20, 2025 05:23 PM
June 20, 2025 04:46 PM
June 20, 2025 03:35 PM

June 9, 2025 10:32 PM

April 7, 2025 03:32 AM

April 3, 2025 03:23 AM

January 15, 2025 10:26 PM