

EUR/USD Talking Points:
- The rally in EUR/USD for this year has run from the 23.6% to the 50% retracement of the 2021-2022 major move, which each level providing support and then resistance.
- RSI is overbought on the daily chart and starting to push back-below 70, begging the question as to whether reversal may be near. This is further investigated below.

The Fibonacci retracement produced by the major move spanning the 2021 high down to the 2022 low continues to have impact on EUR/USD price action.
The bounce from that low was a 61.8% retracement of the prior move, and that Fibonacci retracement also retains interest as areas of confluence at 1.0200 and 1.0611 have shown impact with near-term price action.
But, for now, it’s the 50% marker of the longer-term move, plotted at 1.0943 that’s taking center stage as that level has come in to help hold the highs after one of the strongest rallies in EUR/USD over the past twenty years. The same Fibonacci retracement helped to carve out the 2023 high at the 61.8% retracement, the low for the first-half of last year at the same 1.0943 level, and, so far for 2025, the low at the 23.6% marker of that same Fibonacci setup.
EUR/USD Weekly Price Chart
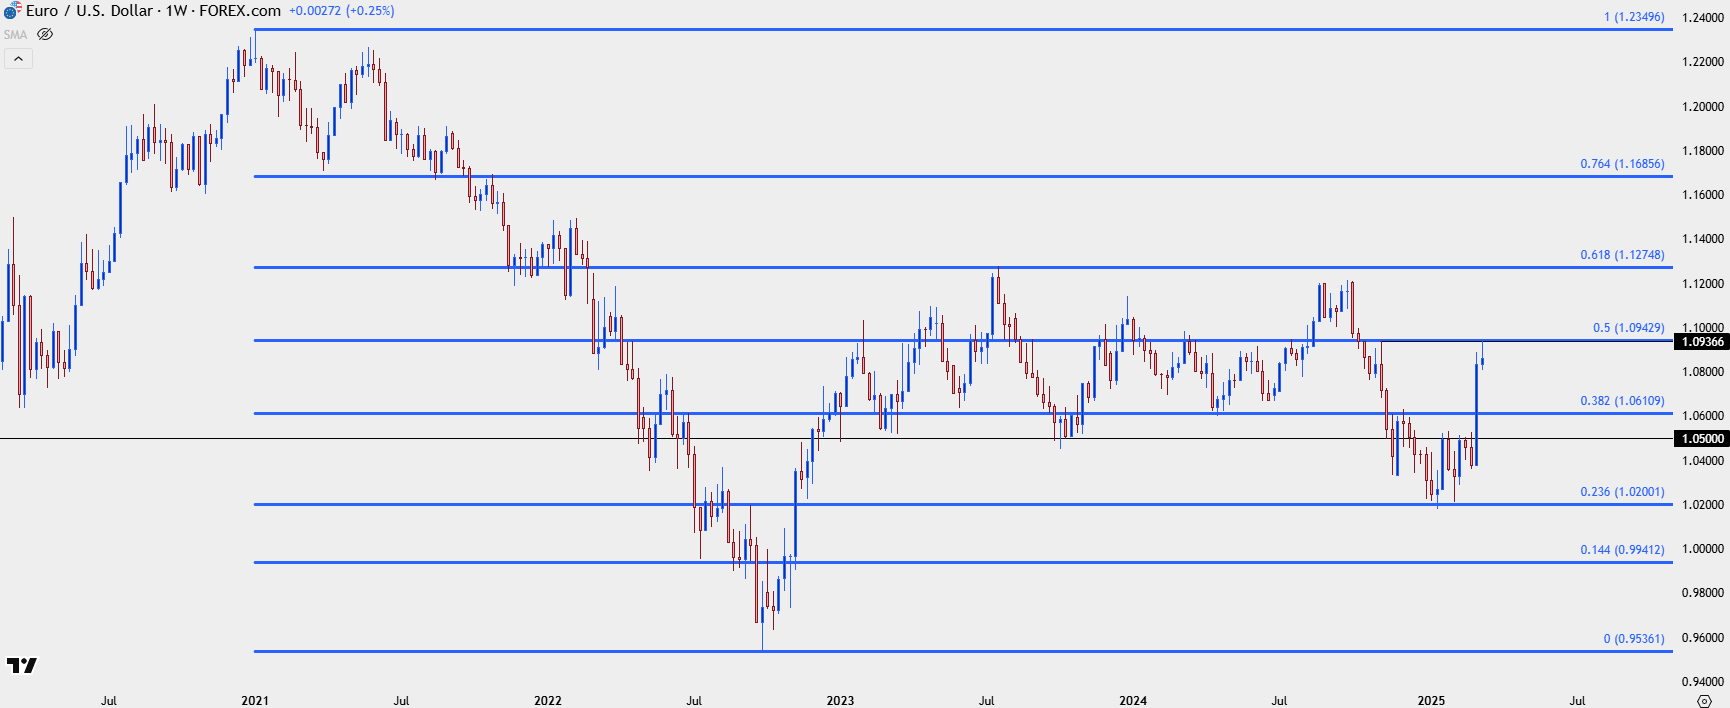 Chart prepared by James Stanley; data derived from Tradingview
EUR/USD Rally Goes Overbought
EUR/USD spent most of the first two months of the year grinding around support at that 23.6% retracement. Interestingly, that price at 1.0200 is also the 61.8% retracement of the bounce from the 2022 lows. The 50% marker from that move came into play multiple times as resistance and then support as bulls were taking over, but the rally in early-March quickly jumped into overbought territory and that’s the first time that daily RSI has moved into overbought for EUR/USD since August of last year.
I don’t like to present RSI as a timing indicator because the fact of the matter is that price can get more overbought, or RSI divergence can show up, like what happened last year when the indicator was overbought previously. But from the daily chart we can see where RSI is making a move back towards the 70-level, often looked at as a bearish indication.
But – there are some key spots of possible supports just below price that bears are first going to have to contend with. And, bigger picture, that 1.0611 level is of interest for longer-term support, as this is another confluent level as the 38.2% retracement of both the 2021-2022 and 2022-2023 major moves. Theoretically, price could fall all the way down to that level, with RSI moving out of overbought territory, at which point the door would open for bigger picture bullish trend continuation.
But, for now, the 200-day moving average is of interest and this plots around 1.0730. A hold there opens the door for a bounce; but if that bounce holds resistance at 1.0865, the 23.6% retracement of the 2022-2023 major move, there may be a lower-high to work with, which would keep the door open to a larger retracement scenario.
On the bullish side – if buyers can defend that same Fibonacci level into the end of the day, exposing an underside wick on the daily chart to highlight the defense of that level, then there’s an open pathway for re-test of the 1.0943 level, after which the 1.1000 handle looms large.
After a move of this magnitude some profit taking wouldn’t be unreasonable, but the big question now is how aggressive bulls might remain to be, and whether they use the dip over the past couple of days to set up bullish trend positions.
EUR/USD Daily Chart
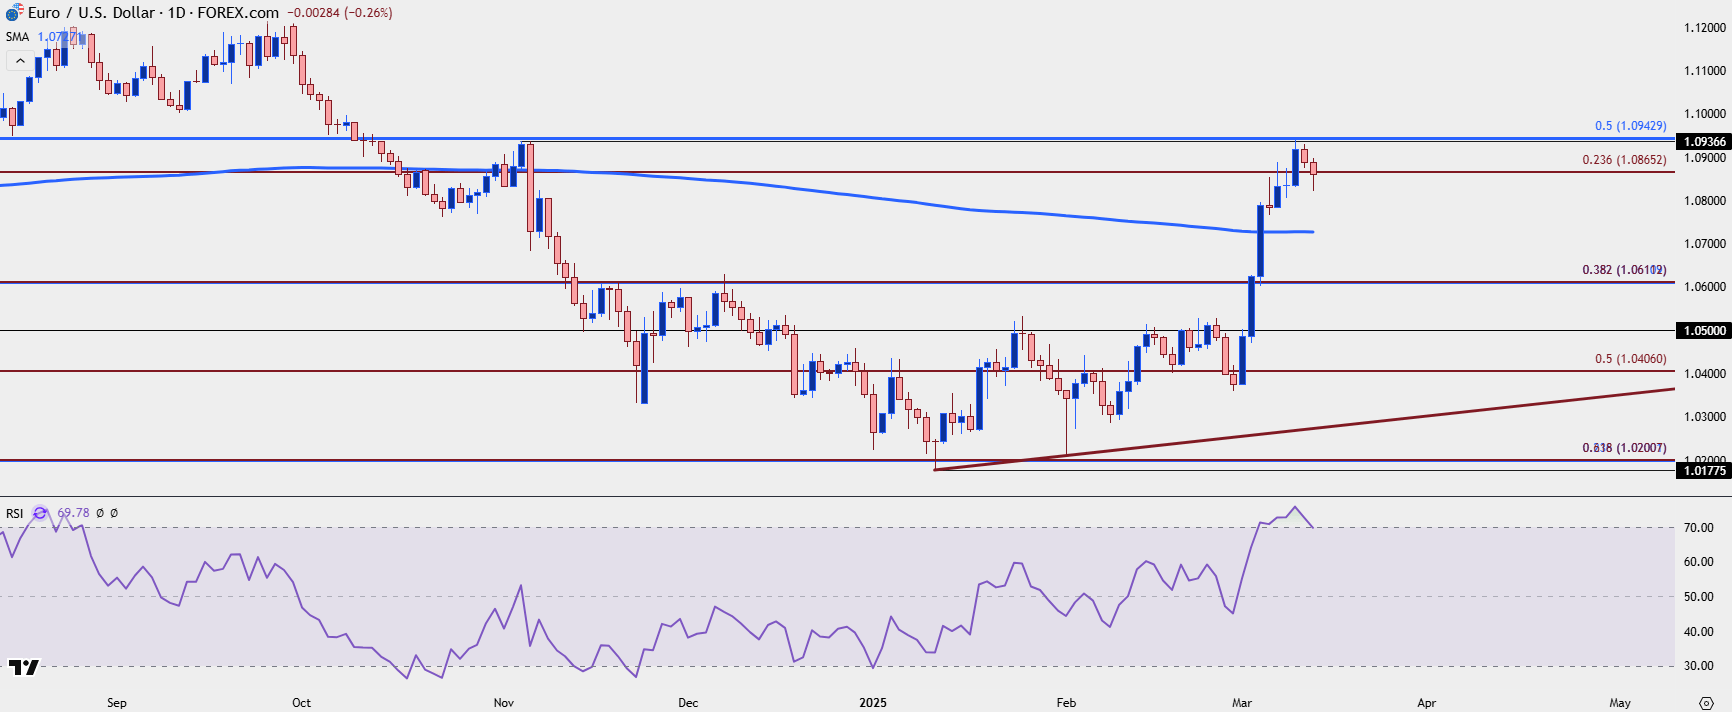 Chart prepared by James Stanley; data derived from Tradingview
--- written by James Stanley, Senior Strategist
Latest market news
September 18, 2025 02:48 PM
June 23, 2025 01:22 PM
June 23, 2025 10:39 AM
June 20, 2025 05:23 PM
June 20, 2025 04:46 PM
June 20, 2025 03:35 PM

June 20, 2025 04:46 PM

June 18, 2025 07:38 PM

June 18, 2025 03:31 PM

June 17, 2025 06:24 PM