

Key Events
- Federal Reserve expected to hold rates at 4.5% on Wednesday; Bank of England (BOE) leans toward a 25-bps rate cut on Thursday
- U.S. ISM Services PMI (today), BOE Governor Bailey's speech (Friday), and Fed member comments (Friday) could elevate market volatility following rate decisions and amid ongoing tariff concerns
Backdrop: Weak U.S. Economic Data Last Week
- Advance GDP: dropped from 2.4% to -0.3%
- Non-Farm Payrolls (NFP): declined from 185K to 177K
- ISM Manufacturing PMI: slipped further into contraction, from 49.0 to 48.7
- Core PCE: fell to 0.0%, the lowest since 2020
Despite the downbeat data, the U.S. Dollar Index (DXY) held a bullish rebound above the 98.00 support, maintaining its inverted head-and-shoulders structure on the 4-hour chart. A confirmation is still needed — particularly a clean breakout above the 100.30 level.
Volatility risks loom as markets brace for the FOMC rate decision, Fed Chair Jerome Powell’s comments, and broader outlooks on the U.S. economy. Meanwhile, with signs of slowing growth and cooling inflation, the BOE is leaning toward a rate cut.
The final wave of volatility this week is expected on Friday, with remarks from Governor Bailey and Fed officials following their respective policy decisions.
DXY Forecast: 4 Hour Time Frame – Log Scale
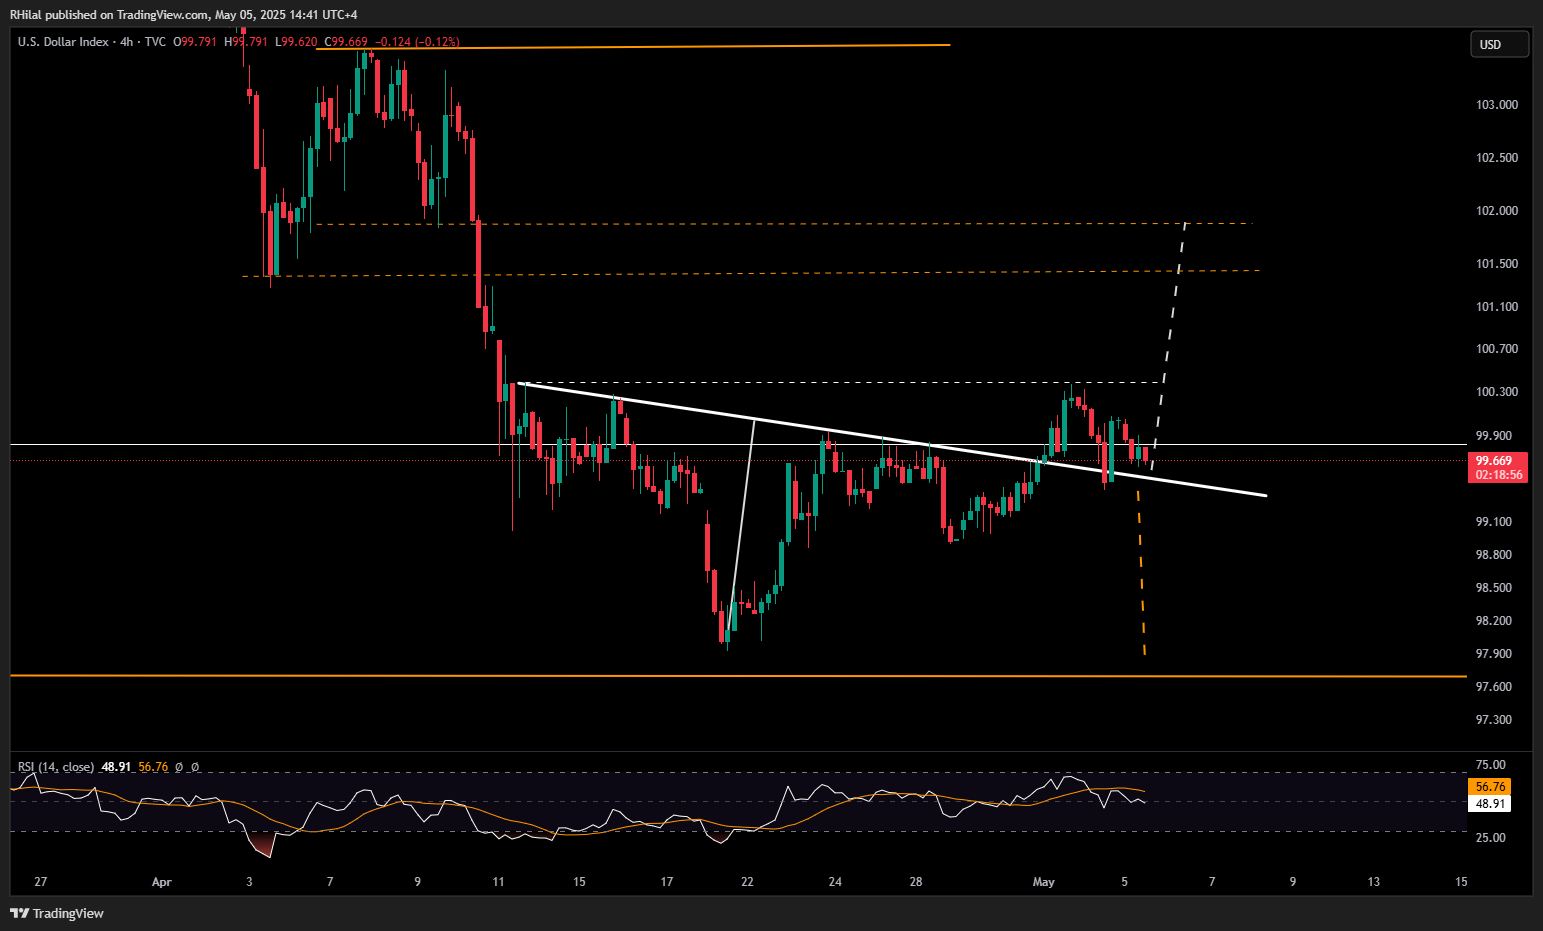
Source: Tradingview
The DXY continues to trade around the neckline of its extended inverted head-and-shoulders pattern formed throughout April. A firm hold above 100.30 is likely needed to confirm a short-term bullish reversal — which would align with potential breakdowns in EURUSD and GBPUSD patterns.
If the index fails to hold above the neckline and slips below 99.40, it may revisit the 98.00 zone, setting the tone for another leg lower in 2025 or, alternatively, establishing a new support base.
EURUSD Forecast: 4 Hour Time Frame – Log Scale
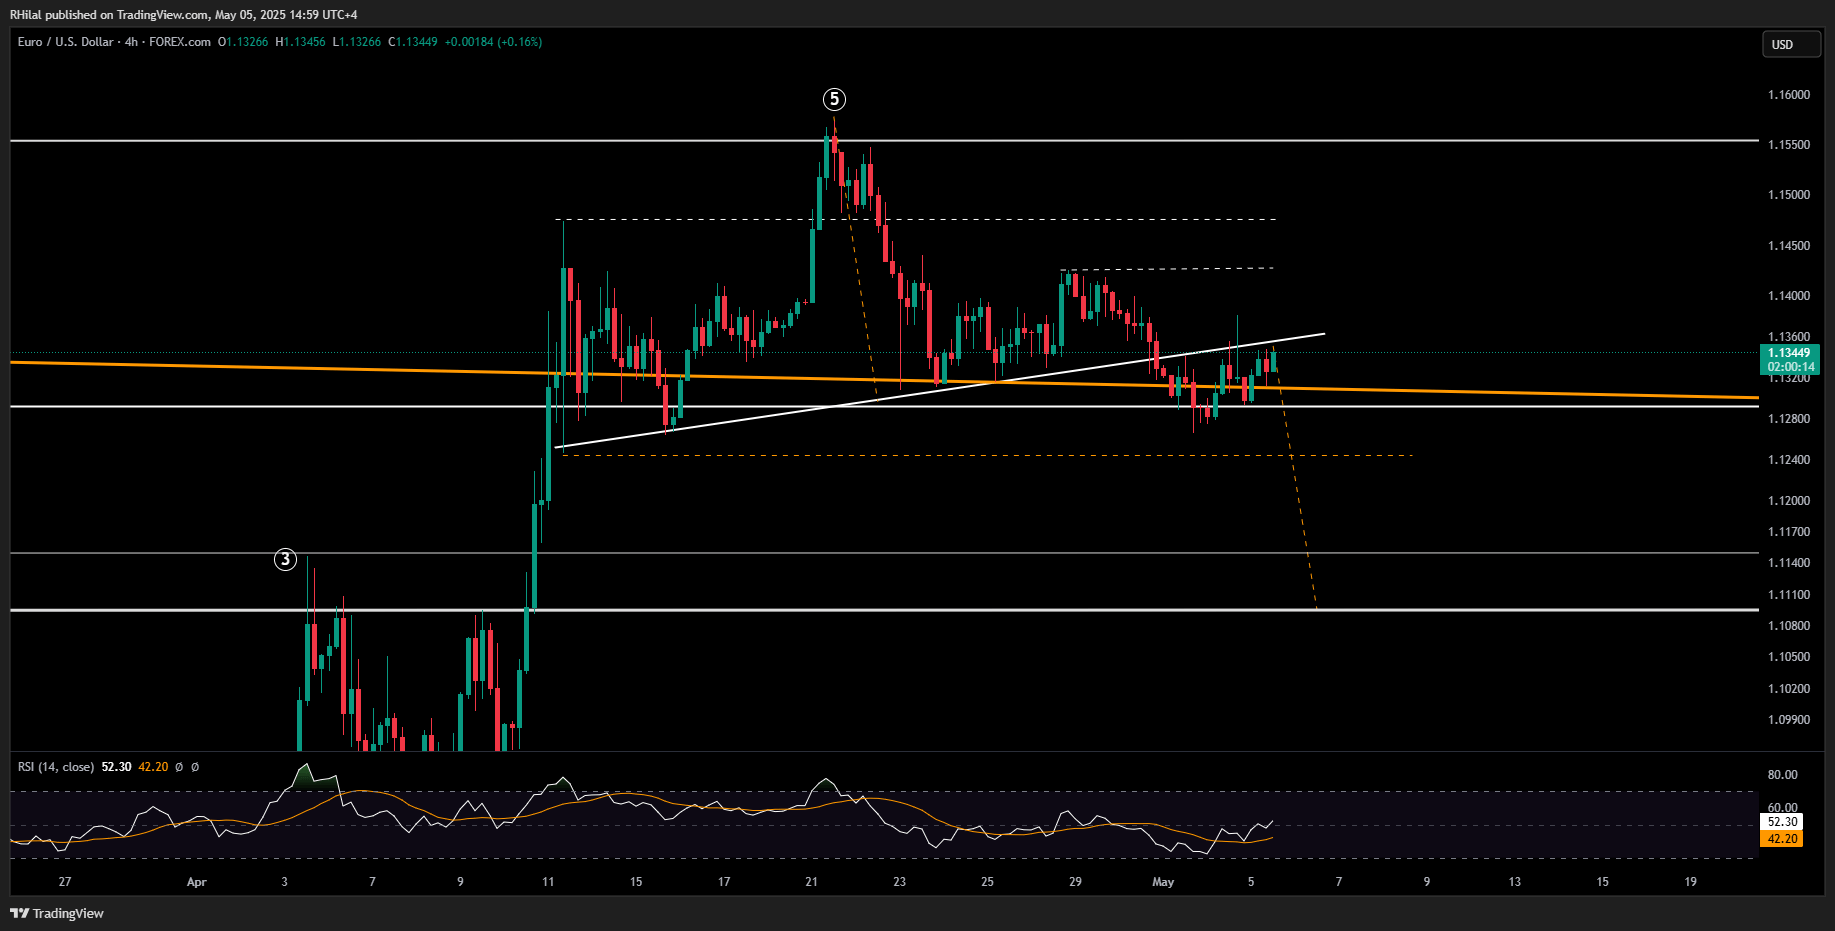
Source: Tradingview
EURUSD has pulled back to the neckline of its head-and-shoulders formation, awaiting a confirmed breakdown. A decisive move below 1.1270 would likely open the path toward 1.1140 and 1.1090. On the flip side, a failed pattern and reversal above 1.1380 may push the pair back up toward 1.1420, 1.1470, and 1.1570.

GBPUSD Forecast: 4 Hour Time Frame – Log Scale
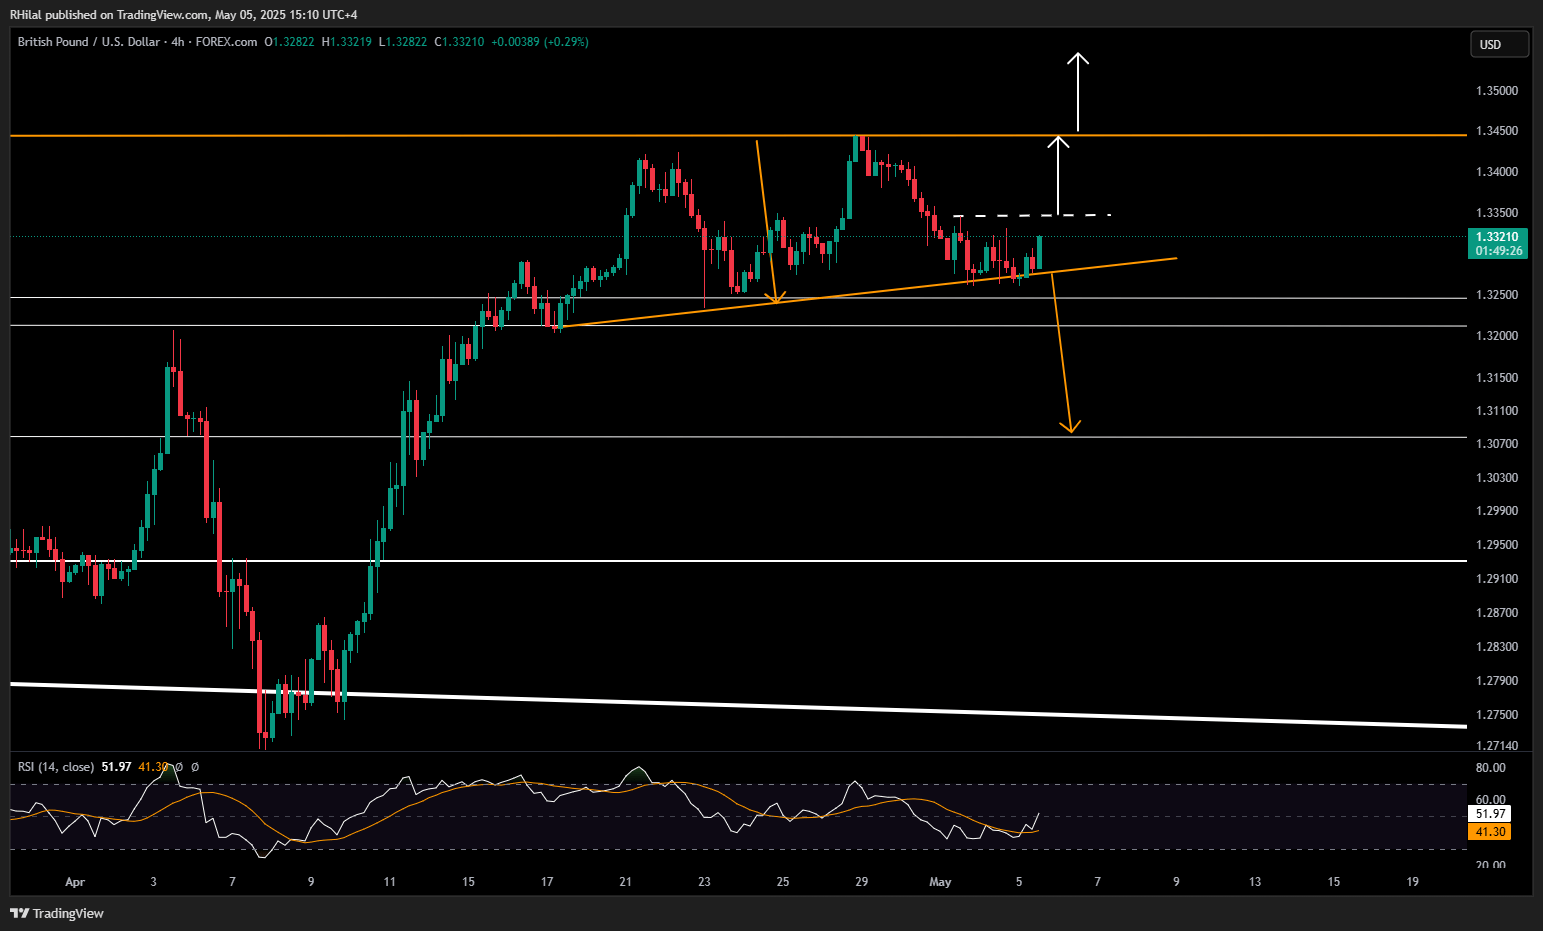
Source: Tradingview
In contrast to EURUSD, the GBPUSD chart reflects a double top rather than a head-and-shoulders pattern. However, unlike DXY and EURUSD, GBPUSD hasn’t broken below its neckline, maintaining a bullish bias as RSI continues to show positive momentum.
Upside Scenario: If the pair breaks above the 1.3345 high, the next targets are 1.3380, 1.3400, 1.3440, and 1.3500.
Downside Scenario: A break below the neckline and 1.3200 support could trigger a decline toward 1.3080, in line with the double top’s projected target.

Written by Razan Hilal, CMT
Follow on X: @Rh_waves
Latest market news
Today 08:29 AM
Yesterday 11:53 PM
Yesterday 09:49 AM

March 19, 2025 10:01 PM

March 19, 2025 08:17 PM

March 19, 2025 03:54 PM

March 19, 2025 12:34 PM