Key Volatility Risks This Week:
- Trade war developments – escalation or resolution
- Chinese and U.S. CPI figures – Thursday
- U.S. Consumer Sentiment data – Friday
- Q1 Bank earnings – Friday: JPMorgan, Wells Fargo, Morgan Stanley, and BlackRock
While chart indicators are flashing signals last seen in 2008, the widely followed “buy the dip” mentality is on shaky ground. Trump's tariff decisions may be ushering in a new market era, challenging bullish narratives across asset classes. However, the link between weak market sentiment and a potential reversal is still being closely watched from a technical standpoint.
Technical Analysis: Quantifying Uncertainties
EURUSD Monthly Time Frame – Log Scale

Source: Tradingview
With the dollar on a downturn, EURUSD is now testing the upper boundary of a long-term descending parallel channel dating back to the 2008 highs. This level coincides with key resistance near 1.12. A sustained breakout above 1.1270 could mark a structural shift, turning the pair’s primary downtrend into a bullish reversal, with upside targets at 1.15, 1.17, and 1.19.
On the other side, if the upper boundary holds as resistance—especially given overbought conditions on the daily charts—EURUSD may retreat towards support levels at 1.07 and 1.05. Shorter-term technical levels are outlined in the next chart.
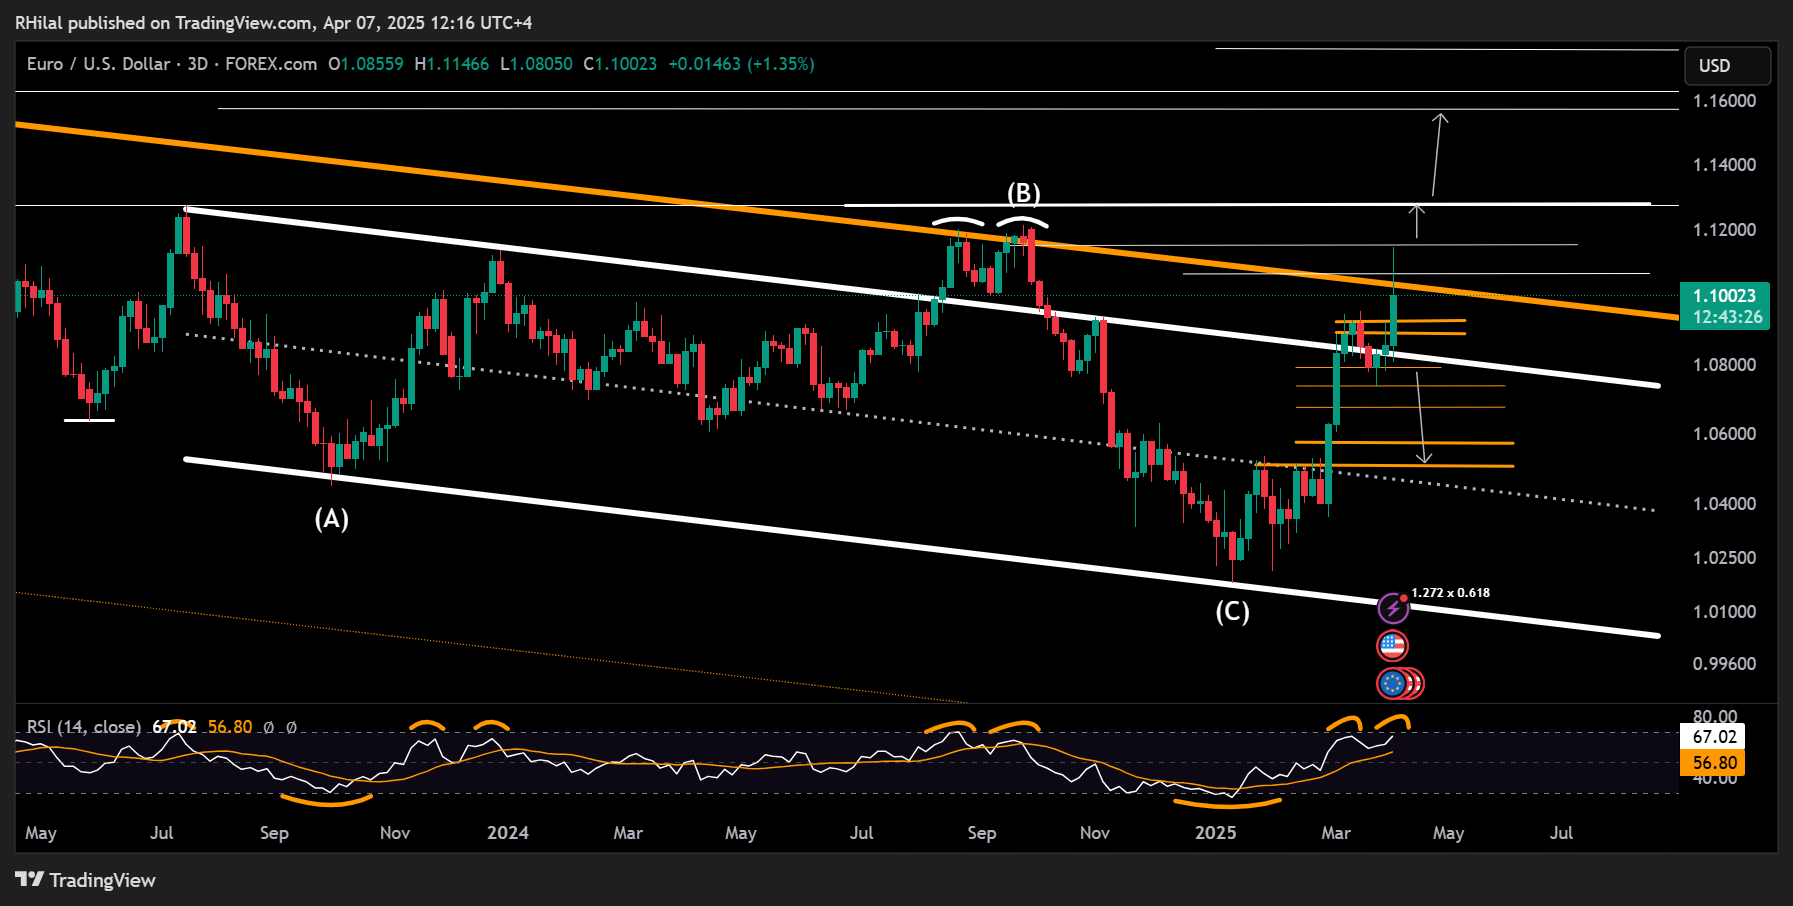
EURUSD 3-Day Time Frame – Log Scale

Source: Tradingview
On the 3-day chart, the pair remains within the boundaries of a descending price channel formed between July 2023 and January 2025. The upper bounds of this range, around 1.0820 and 1.0780, could act as support should the price fall below the 1.09 handle. A decisive break below 1.0780 would open the path toward 1.0730, 1.0670, and 1.0570.
Should this support zone hold, the next area of resistance—and the key battleground for trend direction—lies between 1.1150 and 1.1270. A breakthrough this region would support a continued bullish reversal from the 2025 lows.
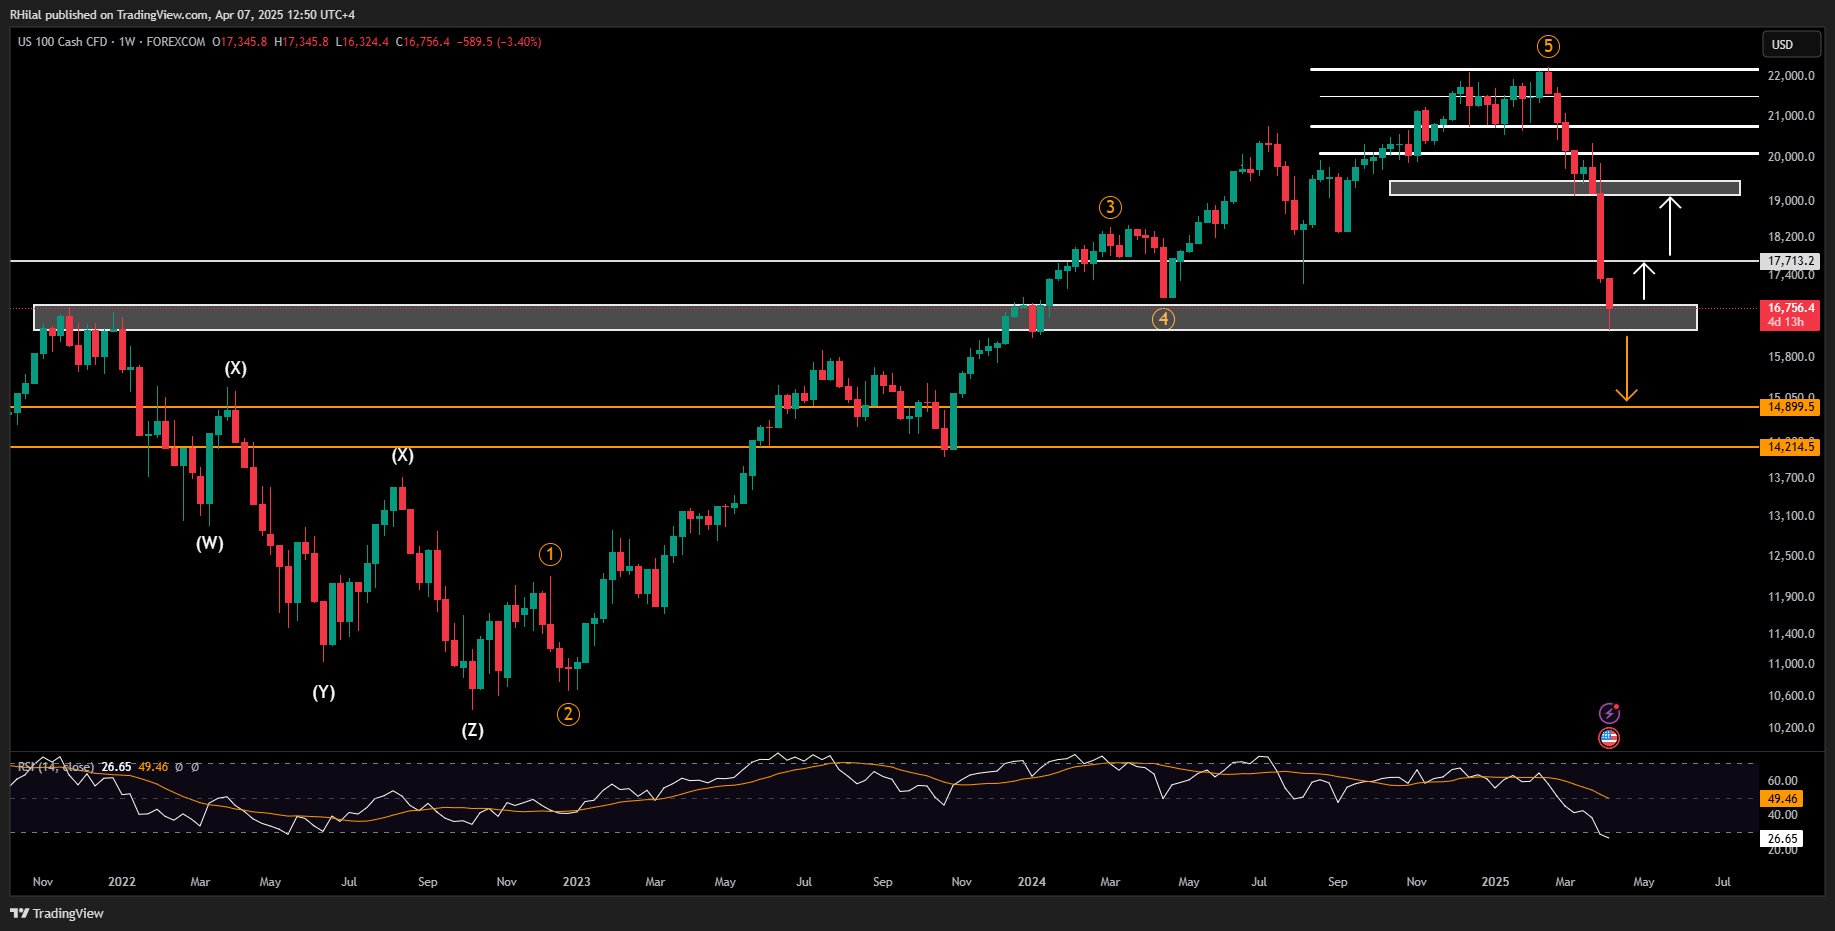
Nasdaq Weekly Time Frame – Log Scale

Source: Tradingview
The Nasdaq recently bounced off the 50% Fibonacci retracement of its uptrend from the October 2022 low (10,430) to the February 2025 high (22,144). This level aligns closely with the 2021 highs near 16,300 and is coupled with an oversold weekly RSI—levels not seen since 2008.
Despite this technical rebound, sentiment remains fragile. With Trump holding tariffs, market confidence is aligning with bear market territory. Still, as the saying goes, markets tend to rebound when headlines hit peak pessimism.
Scenarios Ahead:
- Bearish: A decisive break below the 16,300 support level could trigger a drop toward the 61.8% Fibonacci retracement, around the 15,000–14,900 zone.
- Bullish: If support holds and RSI begins to recover from historically oversold conditions, the index could resume its upward trajectory, targeting 17,700, 19,100, 19,400, and potentially 20,000.
Written by Razan Hilal, CMT
Follow on X: @Rh_waves


