

EUR/USD, Euro Talking Points:
- It’s been a consistent sell-off for EUR/USD since the FOMC rate decision last week, with the pair printing six consecutive red daily candles.
- EUR/USD made a push into a key zone of support in late trade yesterday, and that’s so far brought a bounce. This doesn’t necessarily mean reversal of trend but it has allowed for a pullback to 1.0800, which sellers have so far responded to.
- EUR/USD and the U.S. Dollar are large focal points in each Tuesday webinar, and you’re welcome to join the next. Click here for registration information.

Trend can change quickly in the FX market, and we’ve seen that in the month of March in EUR/USD.
The pair started out the month with one of its strongest bullish breakouts ever, with a breach of the 1.0533 and 1.0600 resistance levels leading to strong topside moves. Buyers continued to push all the way into the 1.0943 Fibonacci level, which first came into play a couple weeks ago; and while bulls persisted for a little more than a week later, that same 1.0943 level refused to yield to breakout, and it was last Wednesday’s candle, around the FOMC rate decision, which sellers started to take over again.
Since then, it’s been an open pathway for bears. It hasn’t been an aggressive push as prices pulled back by about 200 pips over that time in a somewhat controlled manner.
This has all taken place in a very clean format, and I’ve looked at this in webinars over the past two weeks, with the pre-FOMC webinar highlighting a possible turn and then this Tuesday’s webinar highlighting the support test at the 1.0750 level which is confluent with the 200-day moving average. That spot came into play last night and is now leading into a bounce.
EUR/USD Daily Price Chart
 Chart prepared by James Stanley; data derived from Tradingview
EUR/USD Overbought Conditions Rectified
One of the more compelling items pointing to pullbacks a week ago was the RSI divergence that had built on the daily chart of EUR/USD; and the mirror image of that was an RSI divergence of oversold on the U.S. Dollar chart.
Both conditions have now been rectified after pullbacks in each market. The question now is one of continuation: Do we see the shorter-term bearish trend in EUR/USD continue down to fresh lows as more of the March move gets priced-out? Or do we see bulls respond to the pullback from the massive breakout that showed earlier in the month of March?
We’re nearing a spot on the economic calendar where some volatility in the US Dollar and related pairs can be expected. Tomorrow brings the Fed’s preferred inflation gauge of Core PCE. And then next week, at month open and Q2 open, we have the Non-farm Payrolls report on Friday.
For EUR/USD, there’s now a pattern of lower-lows and highs to work with and this highlights resistance potential above the current highs of 1.0800 at 1.0826, 1.0865 and then 1.0909 before the 1.0943 Fibonacci level comes back into play.
For support, the 1.0730-1.0750 zone is still fairly clear as the spot that bears would need to beat to continue the downside trend, and if they can do that, the next major level on the chart is the 1.0611 Fibonacci level.
EUR/USD Four-Hour Price Chart
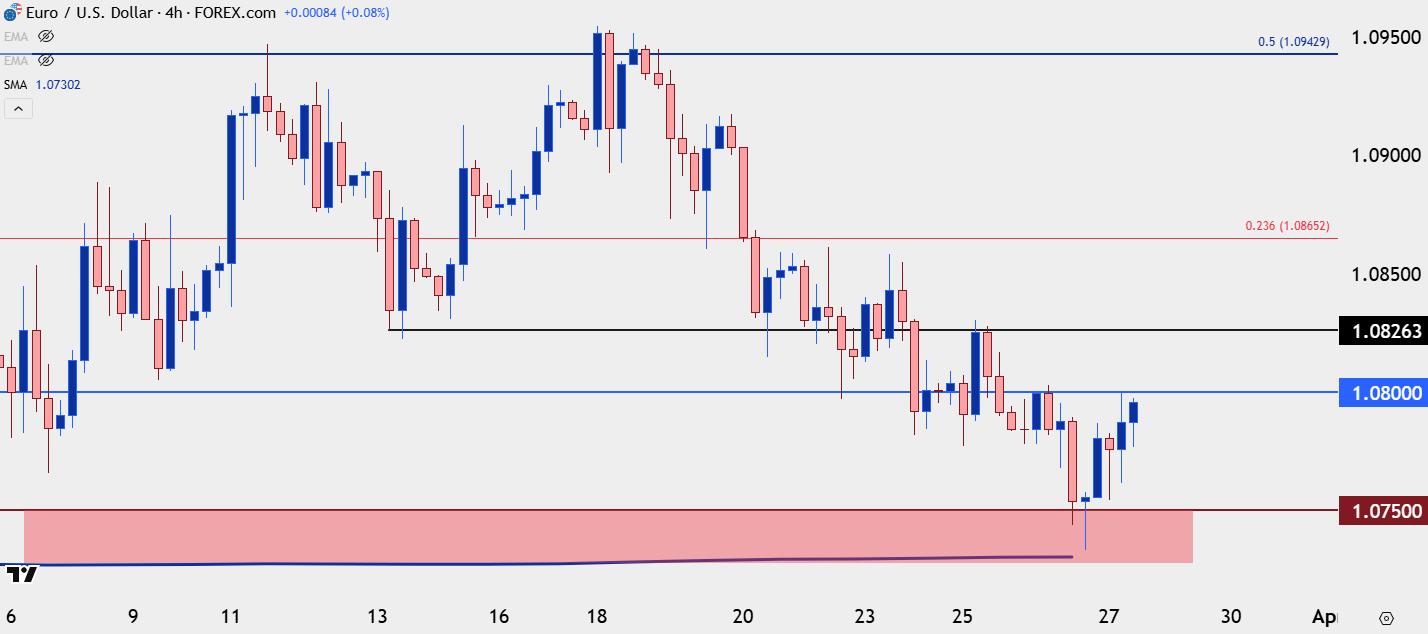 Chart prepared by James Stanley; data derived from Tradingview
--- written by James Stanley, Senior Strategist
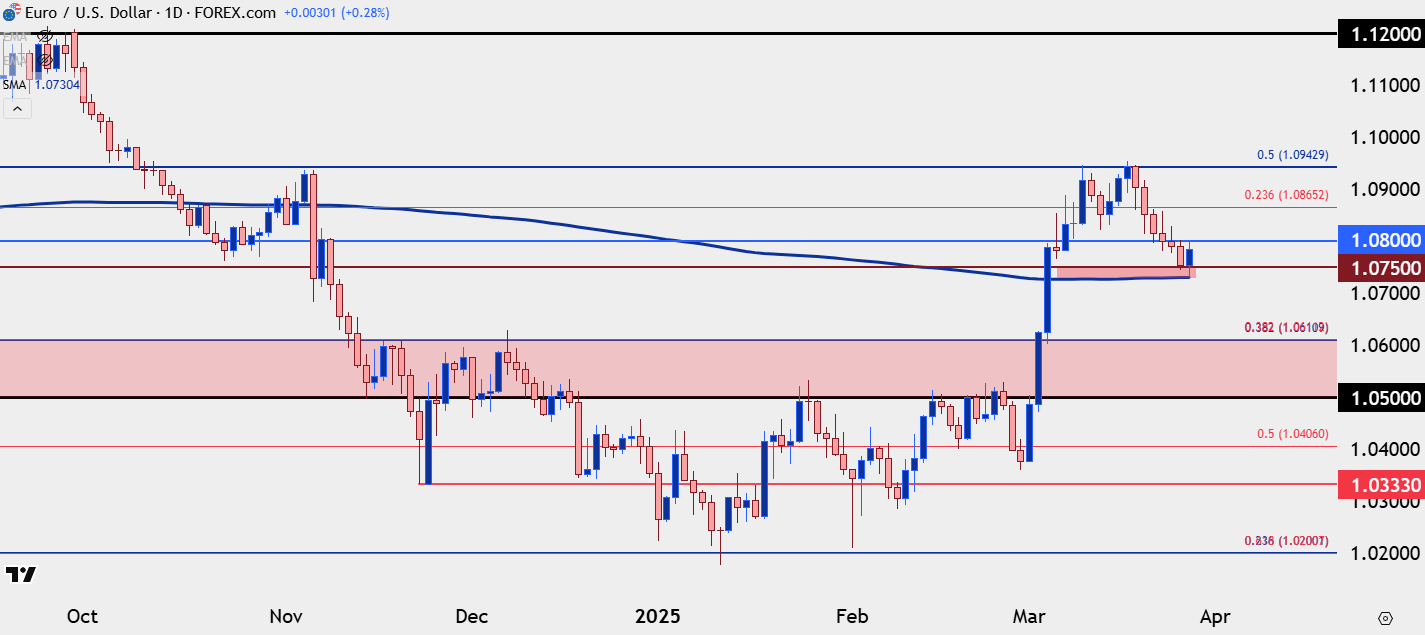 Chart prepared by
 Latest market news
September 18, 2025 02:48 PM
June 23, 2025 01:22 PM
June 23, 2025 10:39 AM
June 20, 2025 05:23 PM
June 20, 2025 04:46 PM
June 20, 2025 03:35 PM

June 17, 2025 08:37 AM

June 16, 2025 08:38 AM

June 2, 2025 08:50 AM

May 28, 2025 02:31 PM